Usage
Overview
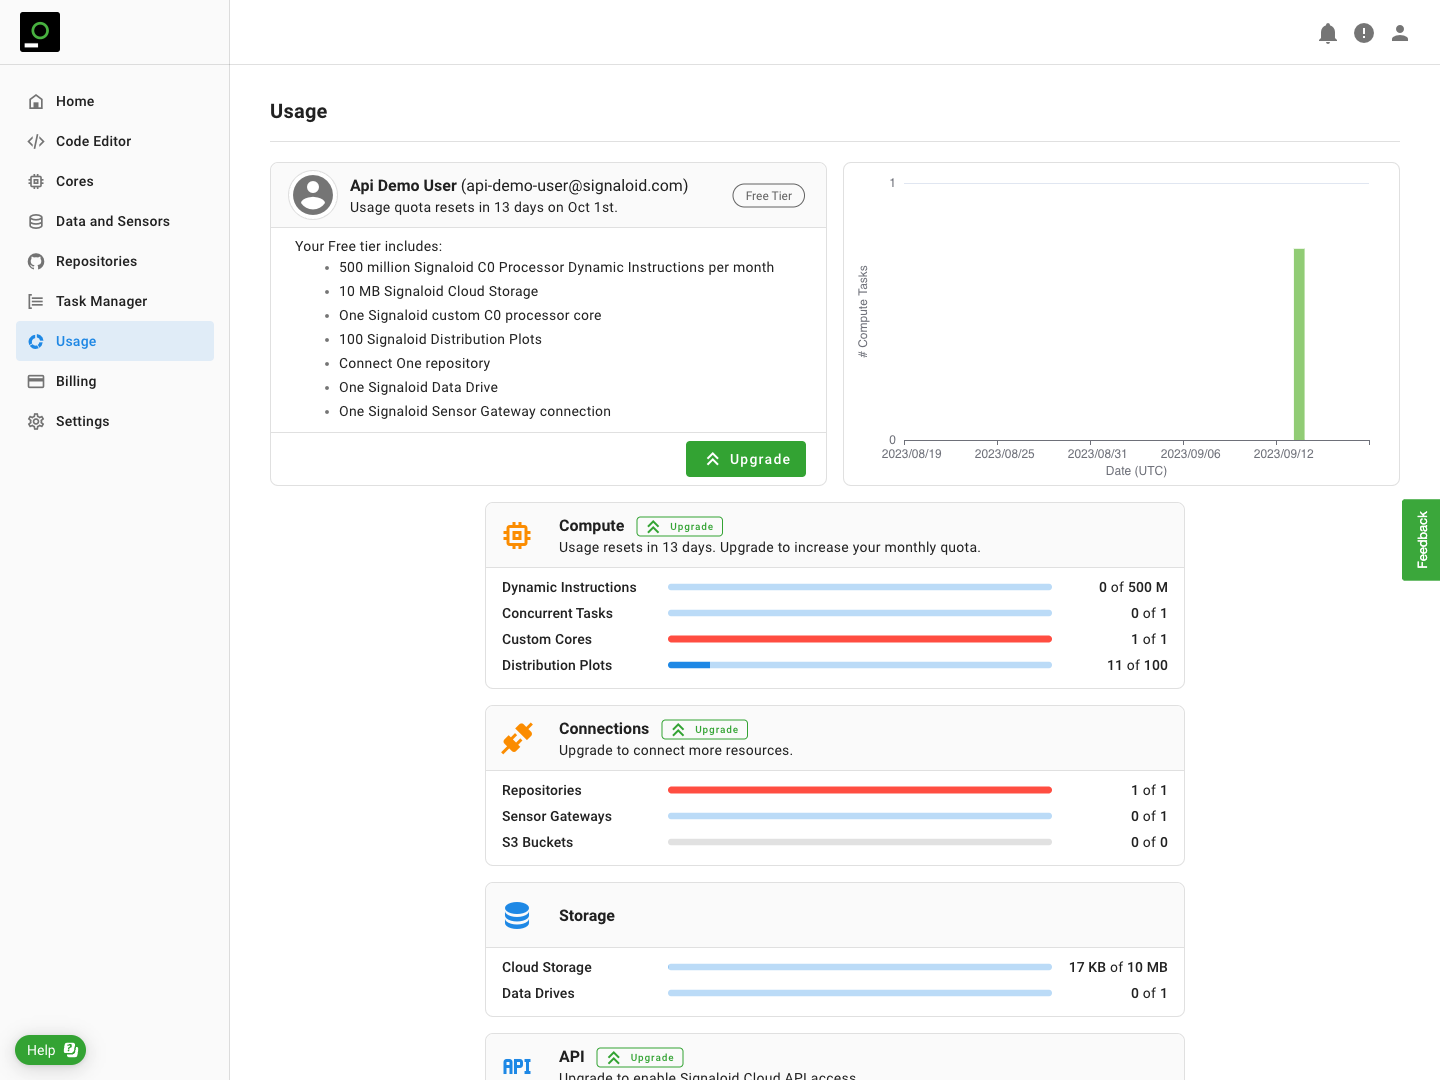
The Usage page shows a summary of how you use the different features of the Signaloid Cloud Developer Platform and the Signaloid Cloud Compute Engine; for example, compute and storage utilization, number of custom cores created, and number of API requests made. The page also gives you an insight into how close you are to exceeding your account tier's resource allocation. You can use this information to optimize your usage and get the most out of the Signaloid Cloud Developer Platform and the Signaloid Cloud Compute Engine.
Usage Page Sections
This dashboard gives you a comprehensive view of your account usage, focusing on various aspects of your usage.
User Information
This section displays account-related information, including your email, name, current account tier, and resources available for your tier. To upgrade your tier, visit the Billing page documentation.
Task History
This section showcases a histogram of tasks created over the past month. Hover over a bar to see daily task counts. Learn more in the Tasks History section.
Compute Section
Here, you'll find a breakdown of your compute resource consumption:
- Dynamic Instructions consumed in the last month.
- Currently running Tasks.
- Custom Signaloid C0 Processors created.
- Generated Distribution Plots.
Connections Section
This section lists elements that you can link to your account:
- Connected repositories.
- Connected Sensor Gateways.
- Connected AWS S3 Buckets.
Storage Section
Here, you can see a summary of your storage usage:
- Cloud Storage usage.
- Number of active Data Drives.
API Section
This section summarizes your interaction with the Signaloid Cloud Compute Engine API, including:
- The number of API requests made to the Signaloid Cloud Compute Engine API.