Task Manager
Access the outputs and other details of tasks you have run on the Signaloid Cloud Compute Engine
Overview
This page provides a detailed description of the Task Manager page where you can inspect the tasks you have executed on the Signaloid Cloud Developer Platform (SCDP) and view their details. For a basic introduction, see the Getting Started guide on accessing task history.
The Signaloid Cloud Developer Platform's Task Manager page, shown in Figure 1, allows you to access the task history
where you can view and inspect the tasks that you have run. Completed tasks show under Completed Tasks,
and tasks that are still running show under Active Tasks. To load more tasks, use the Load more tasks button at the
bottom of the page.
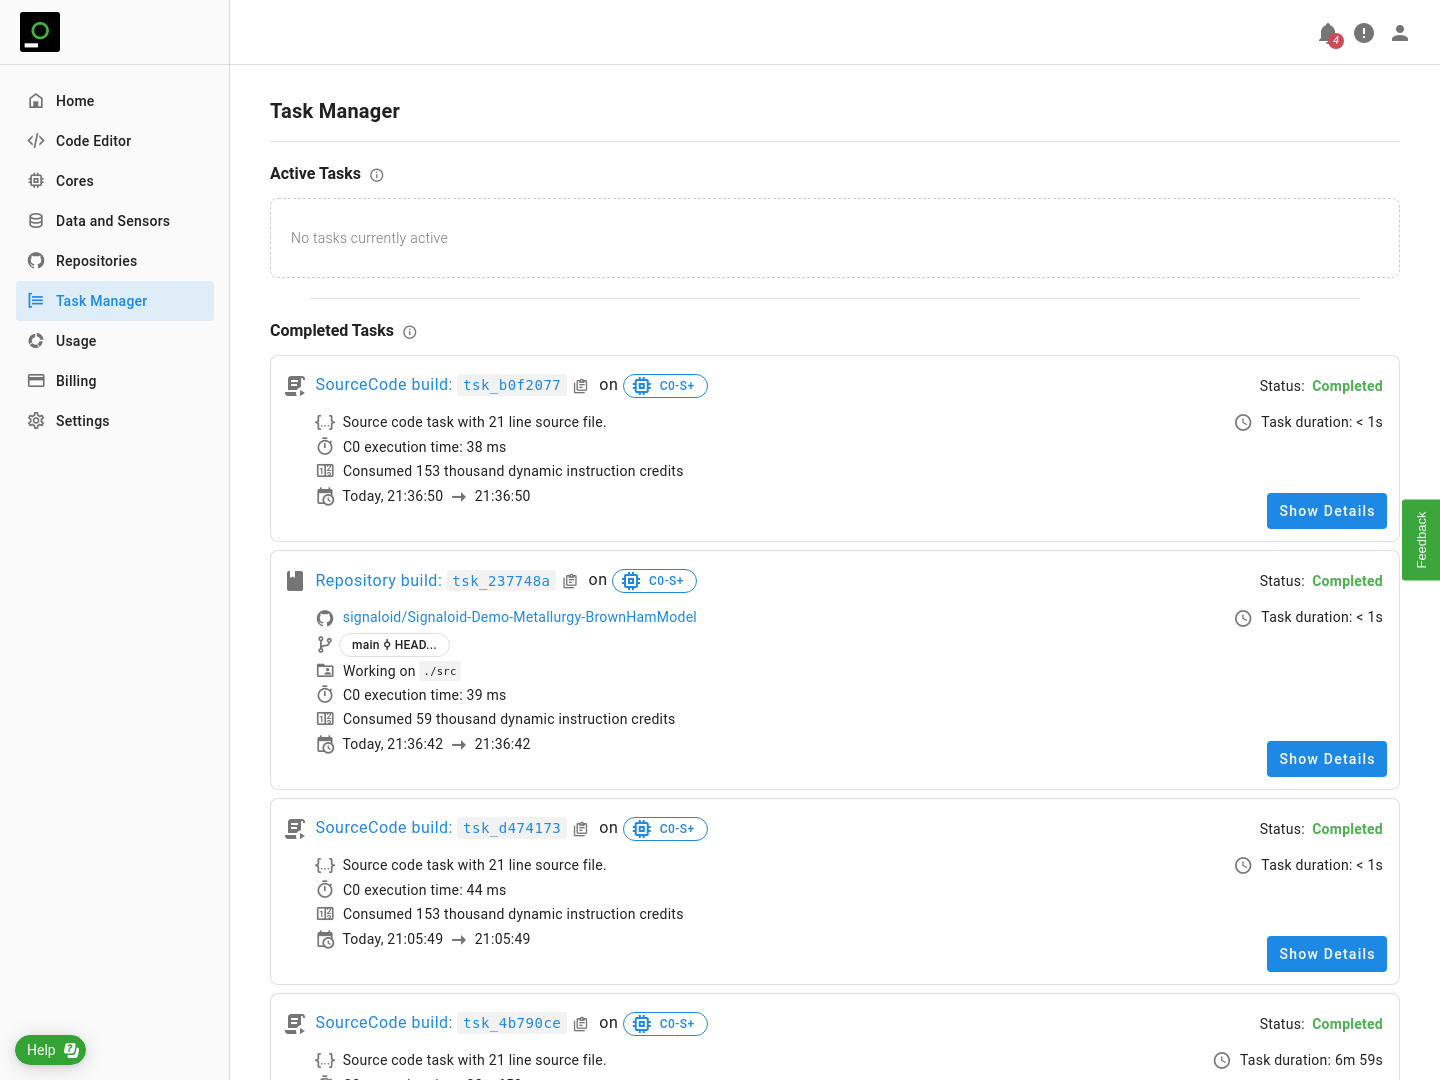
Task card
Each task card contains the following information and utilities:
- Whether the task ran from the Code Editor or the Repositories page
- In case of the Code Editor:
- The number of source code lines
- In case of the Repositories page:
- The link to the repository
- The branch of the repository
- The directory to the source code relative to the repository's root
- In case of the Code Editor:
- The unique id of the task that starts with
tsk_ - The name of the Signaloid core that you ran the task on (hovering on this will show the core details)
- The Signaloid core execution time of the task (excluding the time elapsed during communication with the server)
- How many dynamic instruction credits the task has consumed
- The start and end dates and times of the task's execution (including the time elapsed during communication with the server)
- The task's status
- The total duration of the task (including the time elapsed during communication with the server)
- The
Show Detailsbutton that takes you to the task detials page
To view the task details of a task, including the task outputs, click the Show Details button
(or alternatively, the task id tsk_...) on the corresponding task card. This will take you to
the task details page, similar to the one shown in Figure 2.
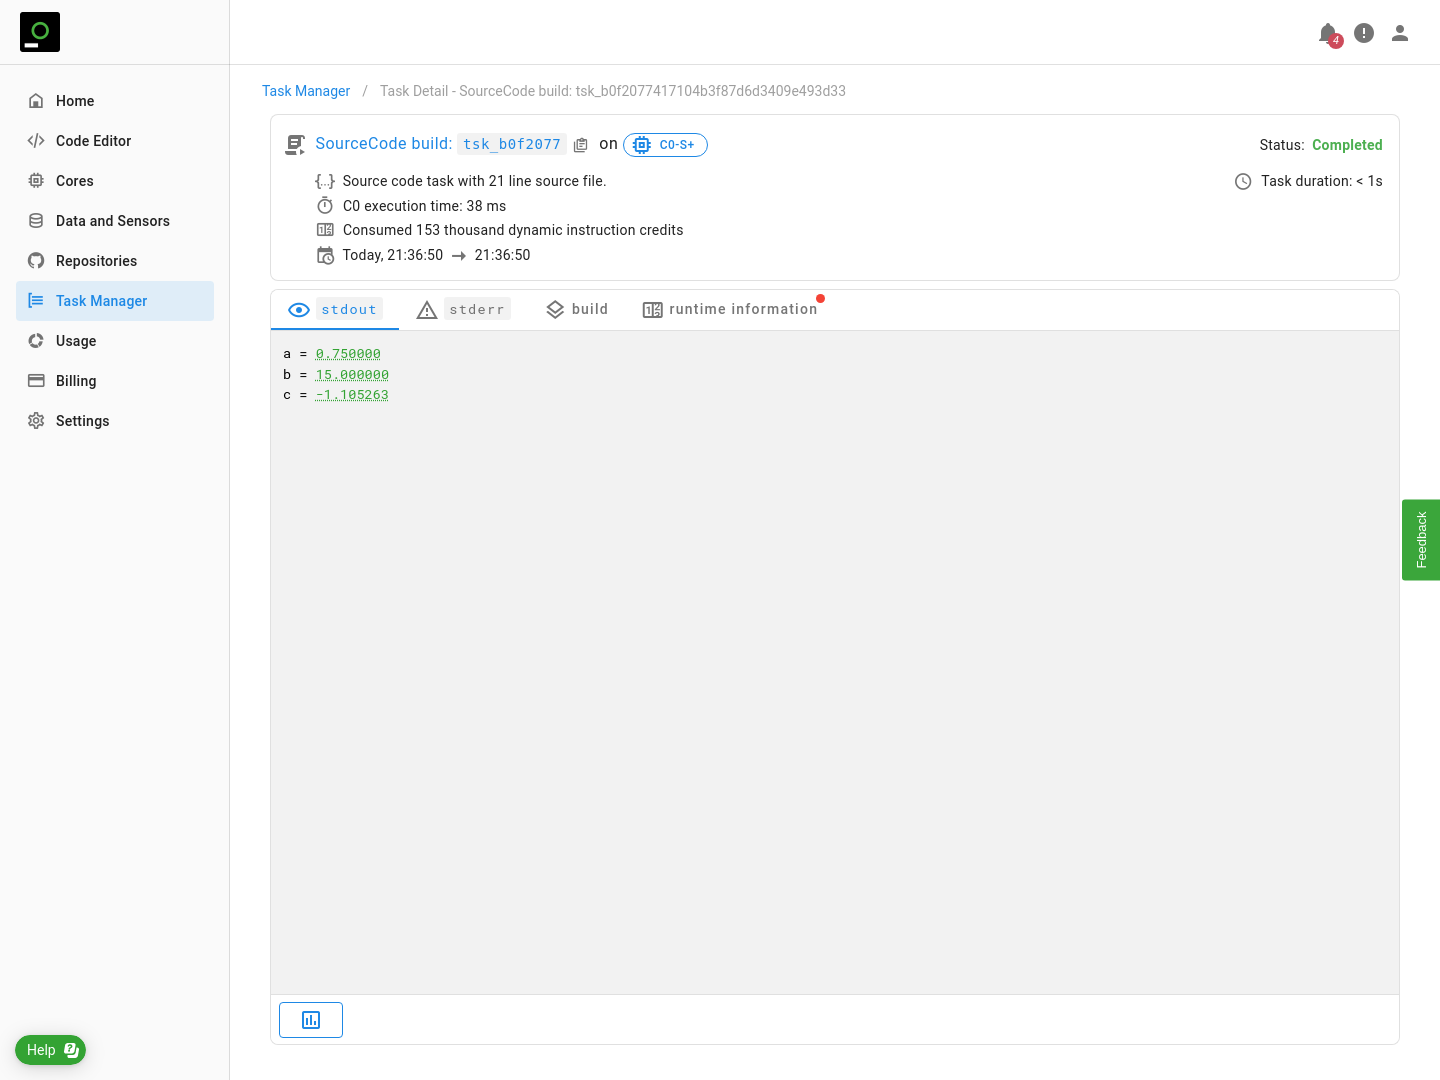
Task details page
The task details page is where you can inspect the output of the task you have run. Below the task card, it has an output window which comprises the following tabs:
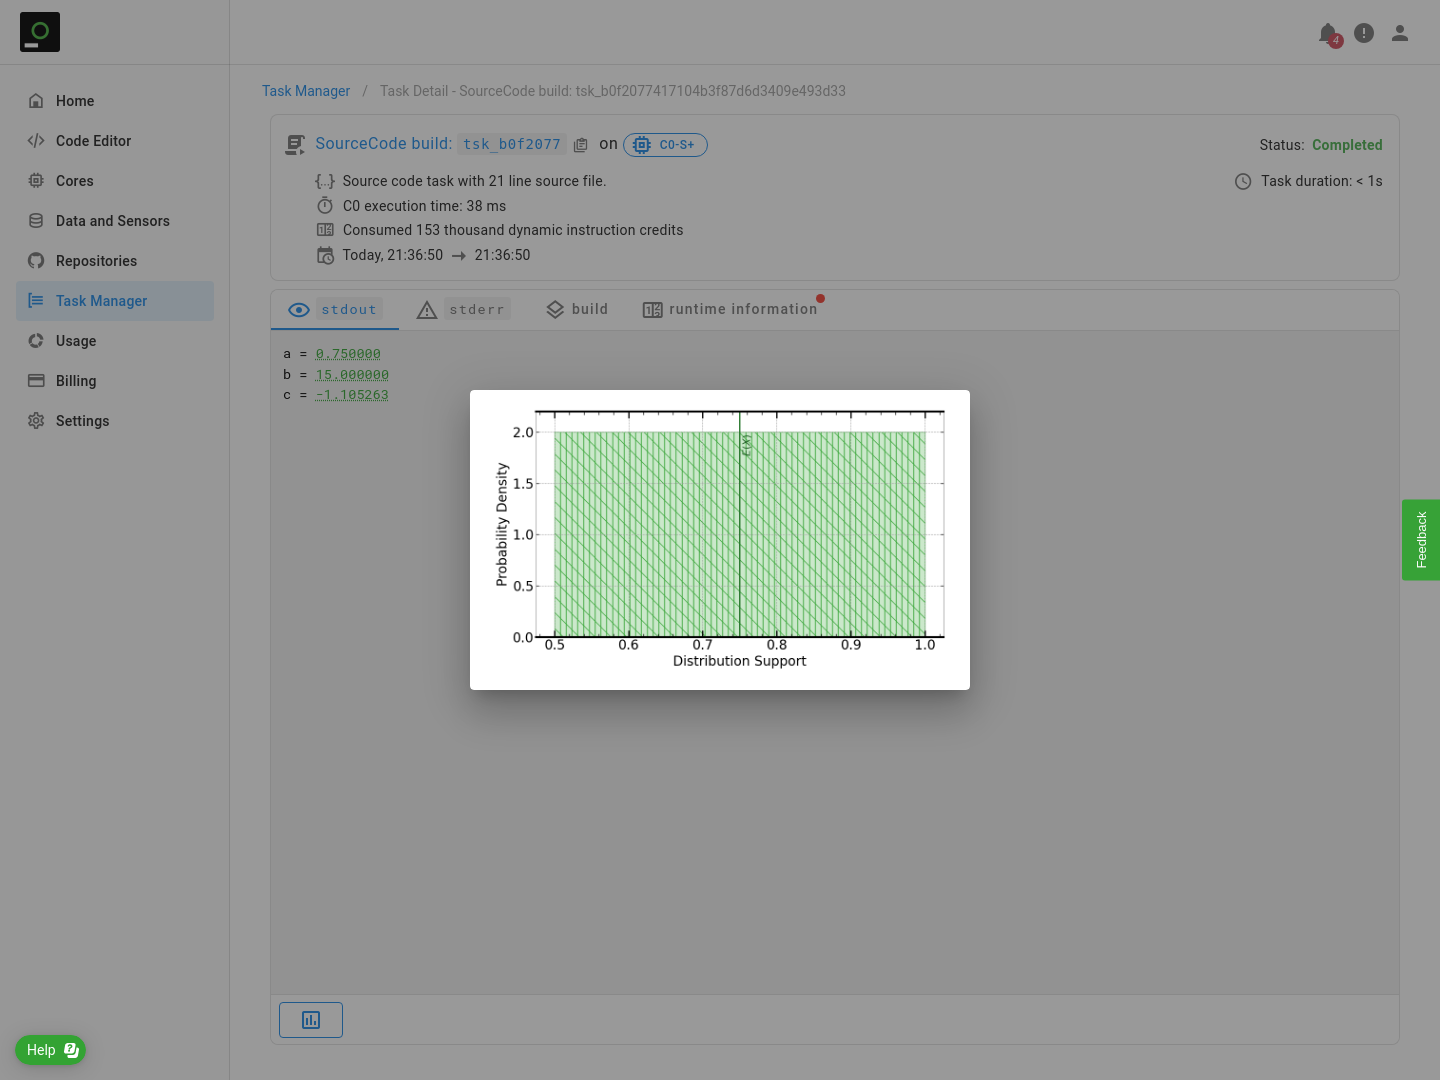
stdout: Shows thestdoutof the task. This is where the standard numerical outputs of the task appear. Floating point numbers (i.e., of typefloatordouble) appear underlined and colored green. Hovering on such a number or clicking it reveals a plot of the distribution of the variable that corresponds to that number, as shown in Figure 3.
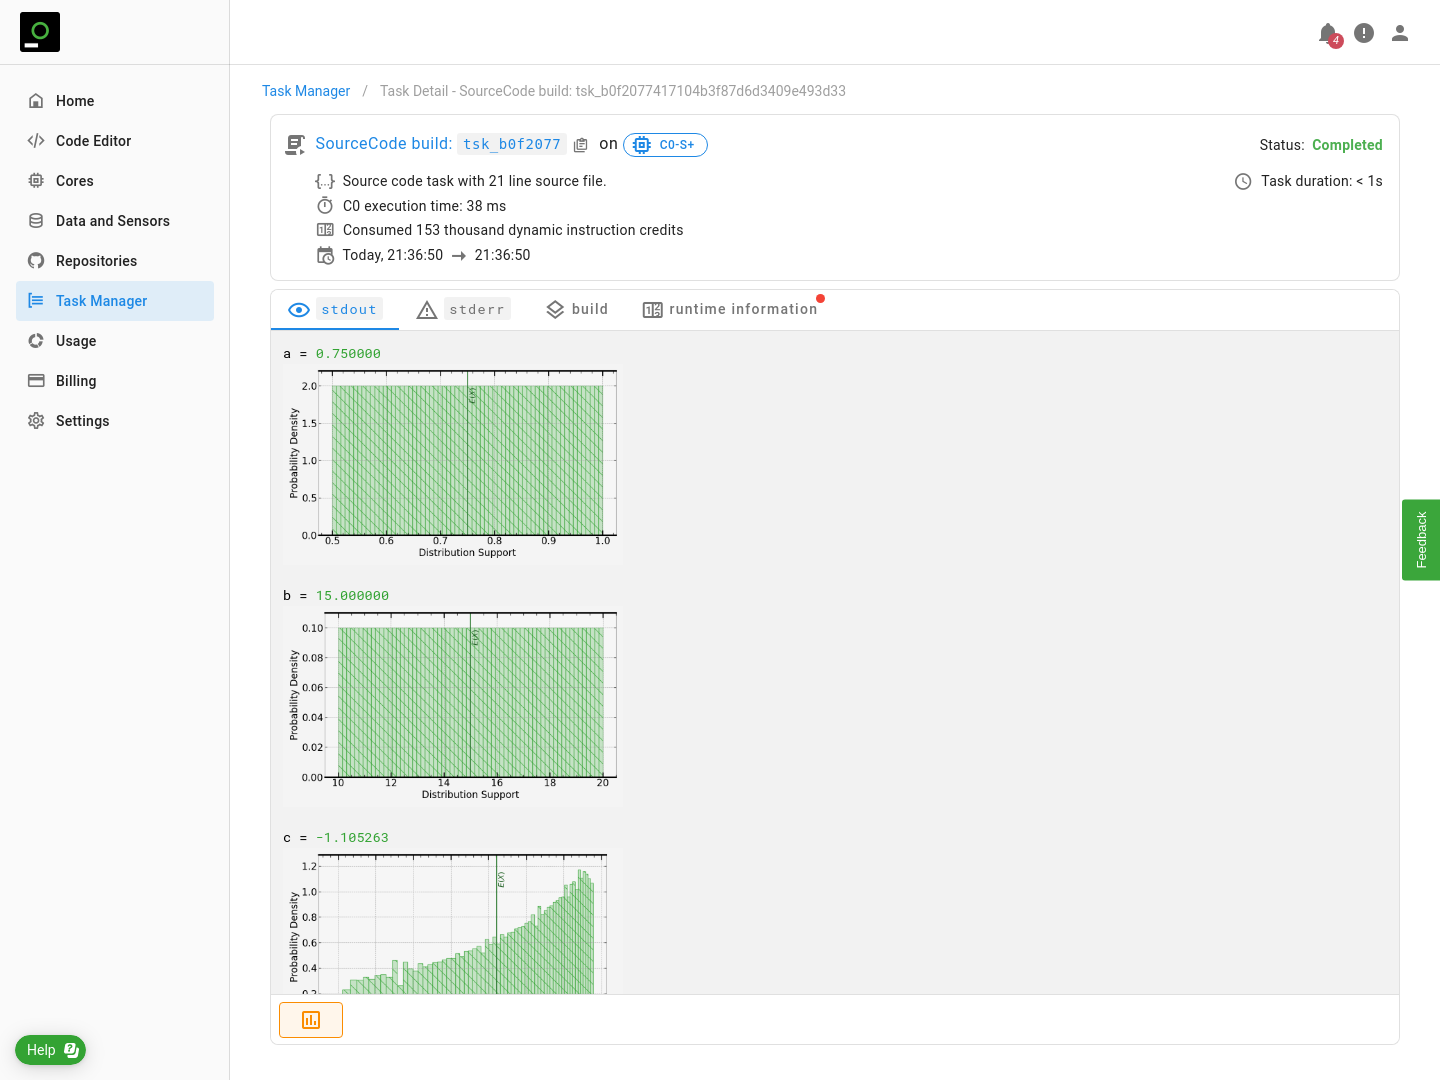
As shown in Figure 4, clicking the icon at the bottom of the window will force the plots corresponding to all the floating point numbers to be shown.
stderr: Shows thestderrof the task. This is where the run-time errors will show.build: Shows the compile-time errors of the task.runtime information: Reports the C0 execution time of the task and the dynamic instruction credits consumed by the task.