Code Editor
The Code Editor allows you to run source code snippets on Signaloid's uncertainty-tracking processors
Editor
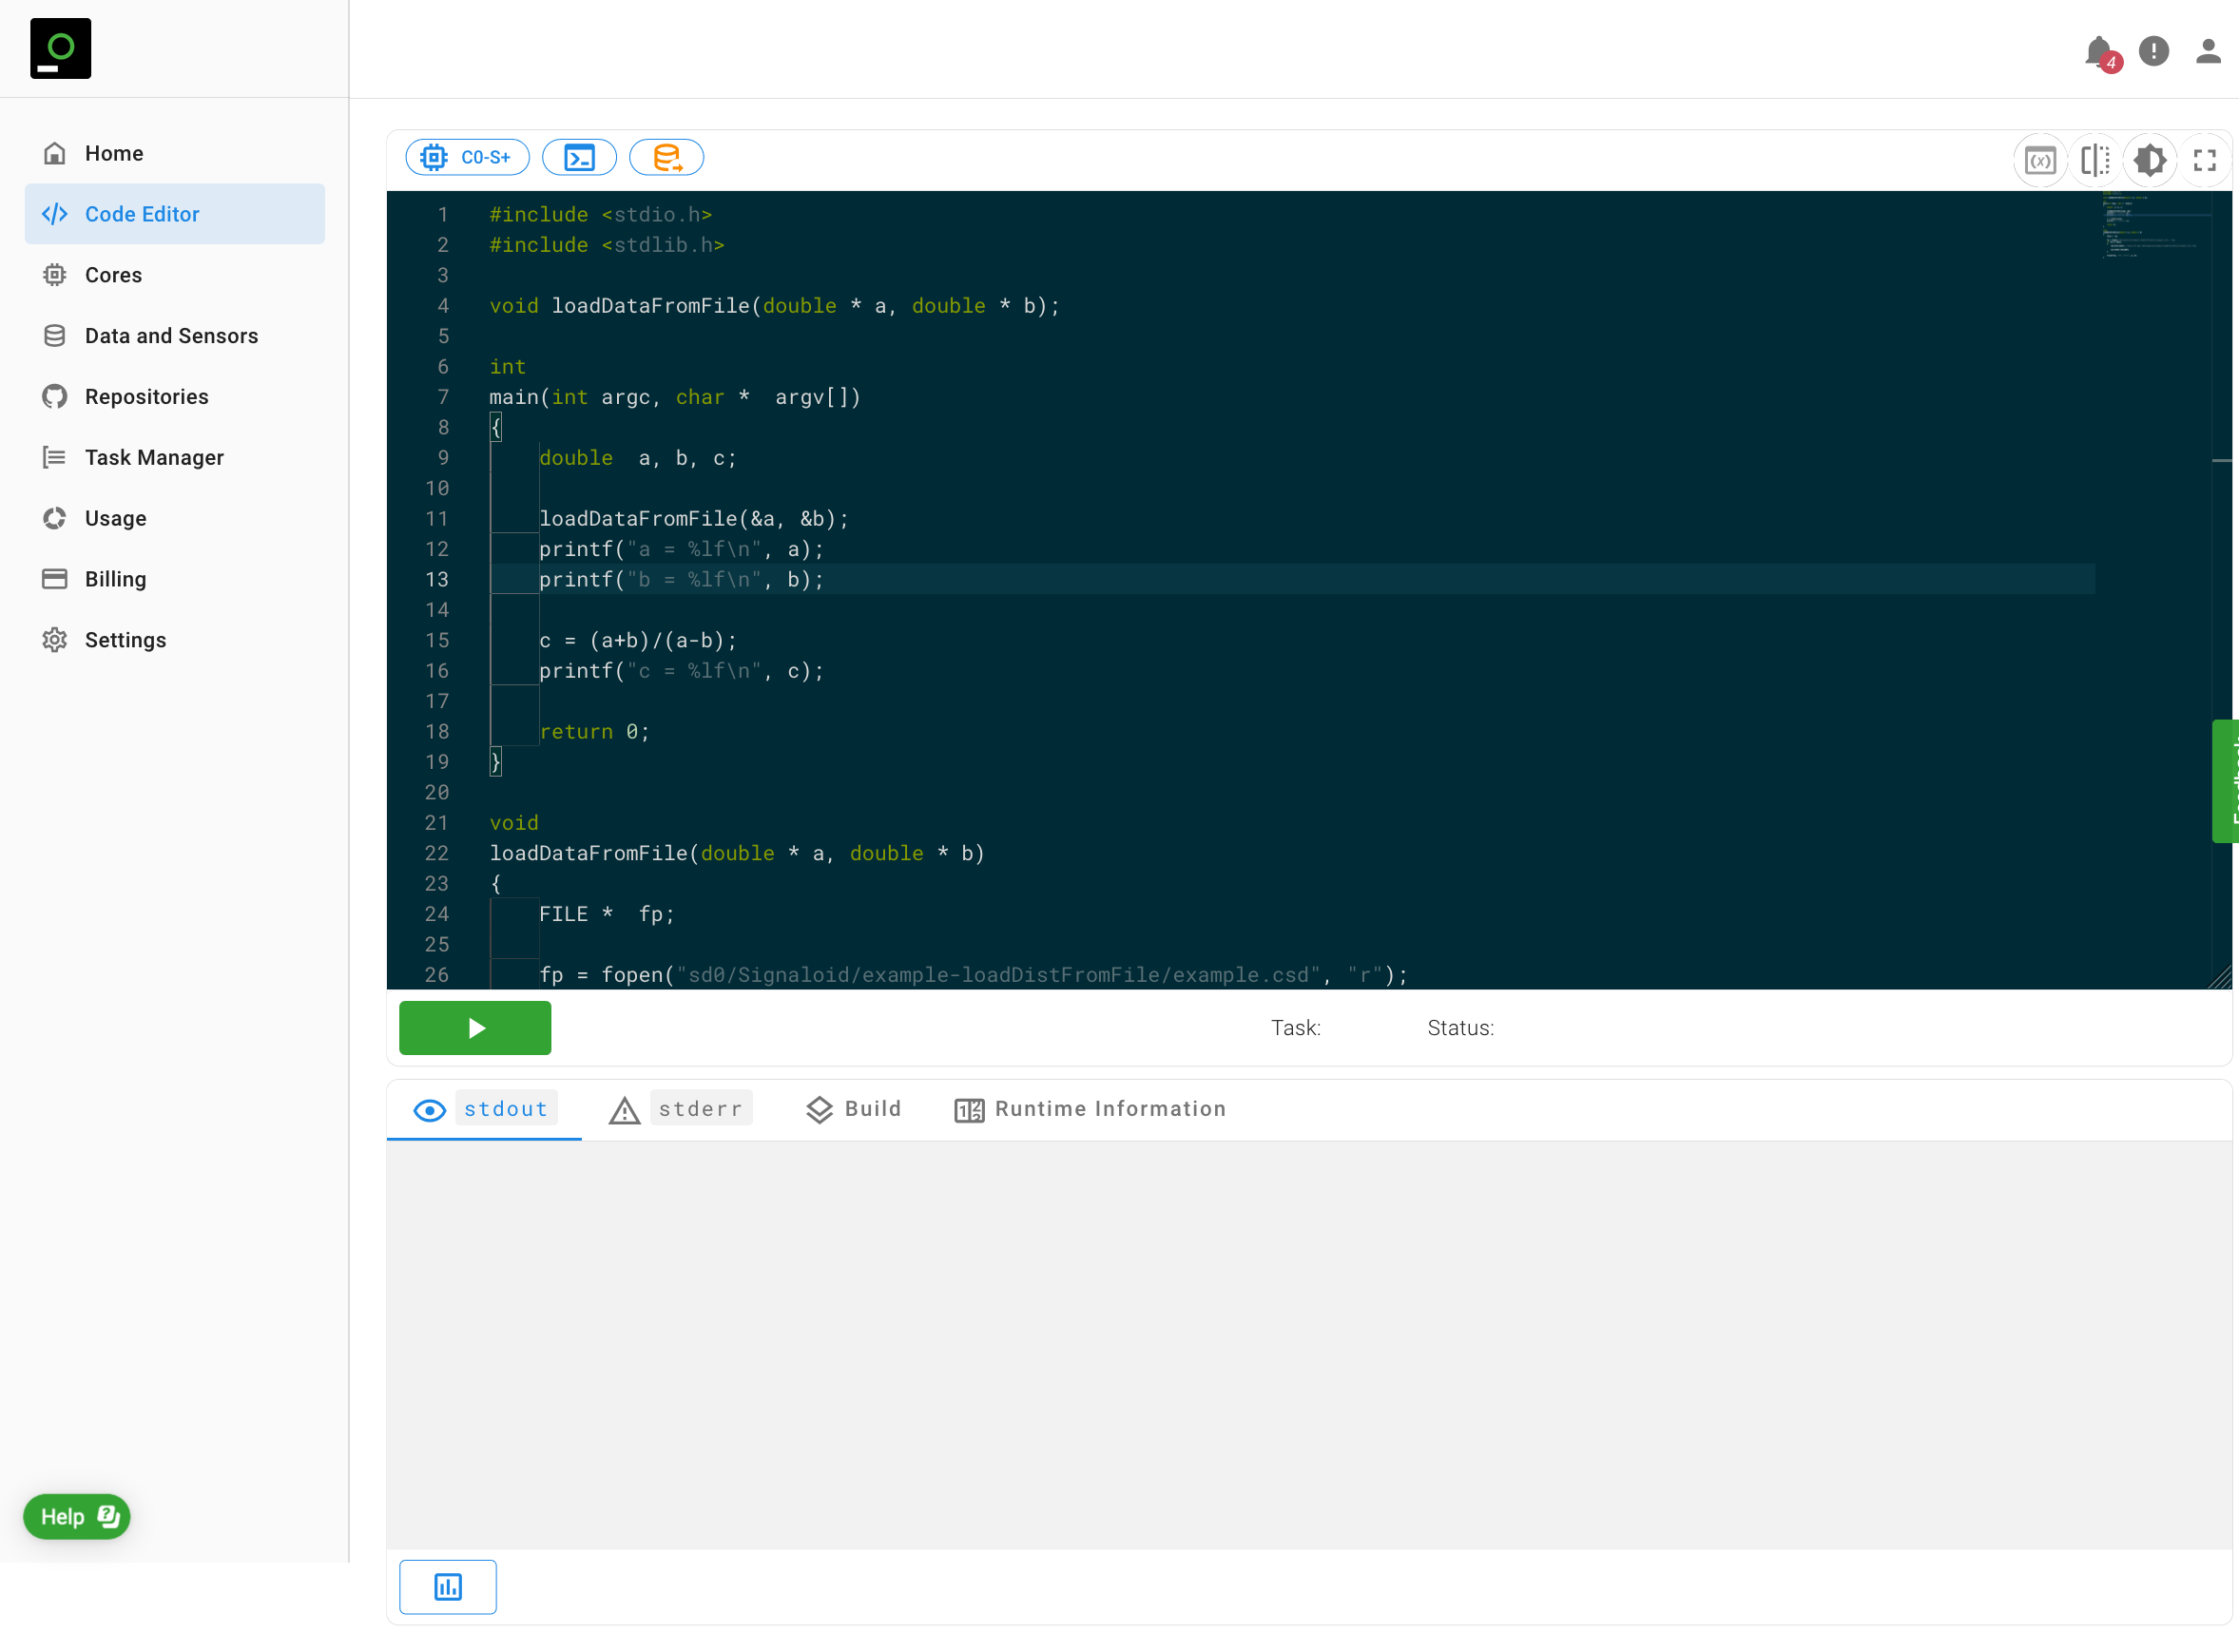
The Signaloid Cloud Developer Platform offers you a way to directly run source code on Signaloid uncertainty-tracking C0 processors using the Code Editor (Figure 1).
The page contains the Editor, the Result Panel, and Variable Viewer:
- Editor—allows you to directly write code and run it on the Signaloid Cloud Compute Engine. The Editor contains controls to specify the Core to run on and the command line arguments for the program, to configure Data Sources, and theme () and layout controls ( or ). Jump to Editor section.
- Result Panel—has tabs that show the program outputs and other runtime information after executing the program. Jump to Results Panel section.
- Variable Viewer—allows to discover and select variables to trace during execution of the program on a Core with the Reference microarchitecture. The Variable Viewer is hidden by default: toggle it with the button. Jump to Variable Viewer section.
Configuration panel
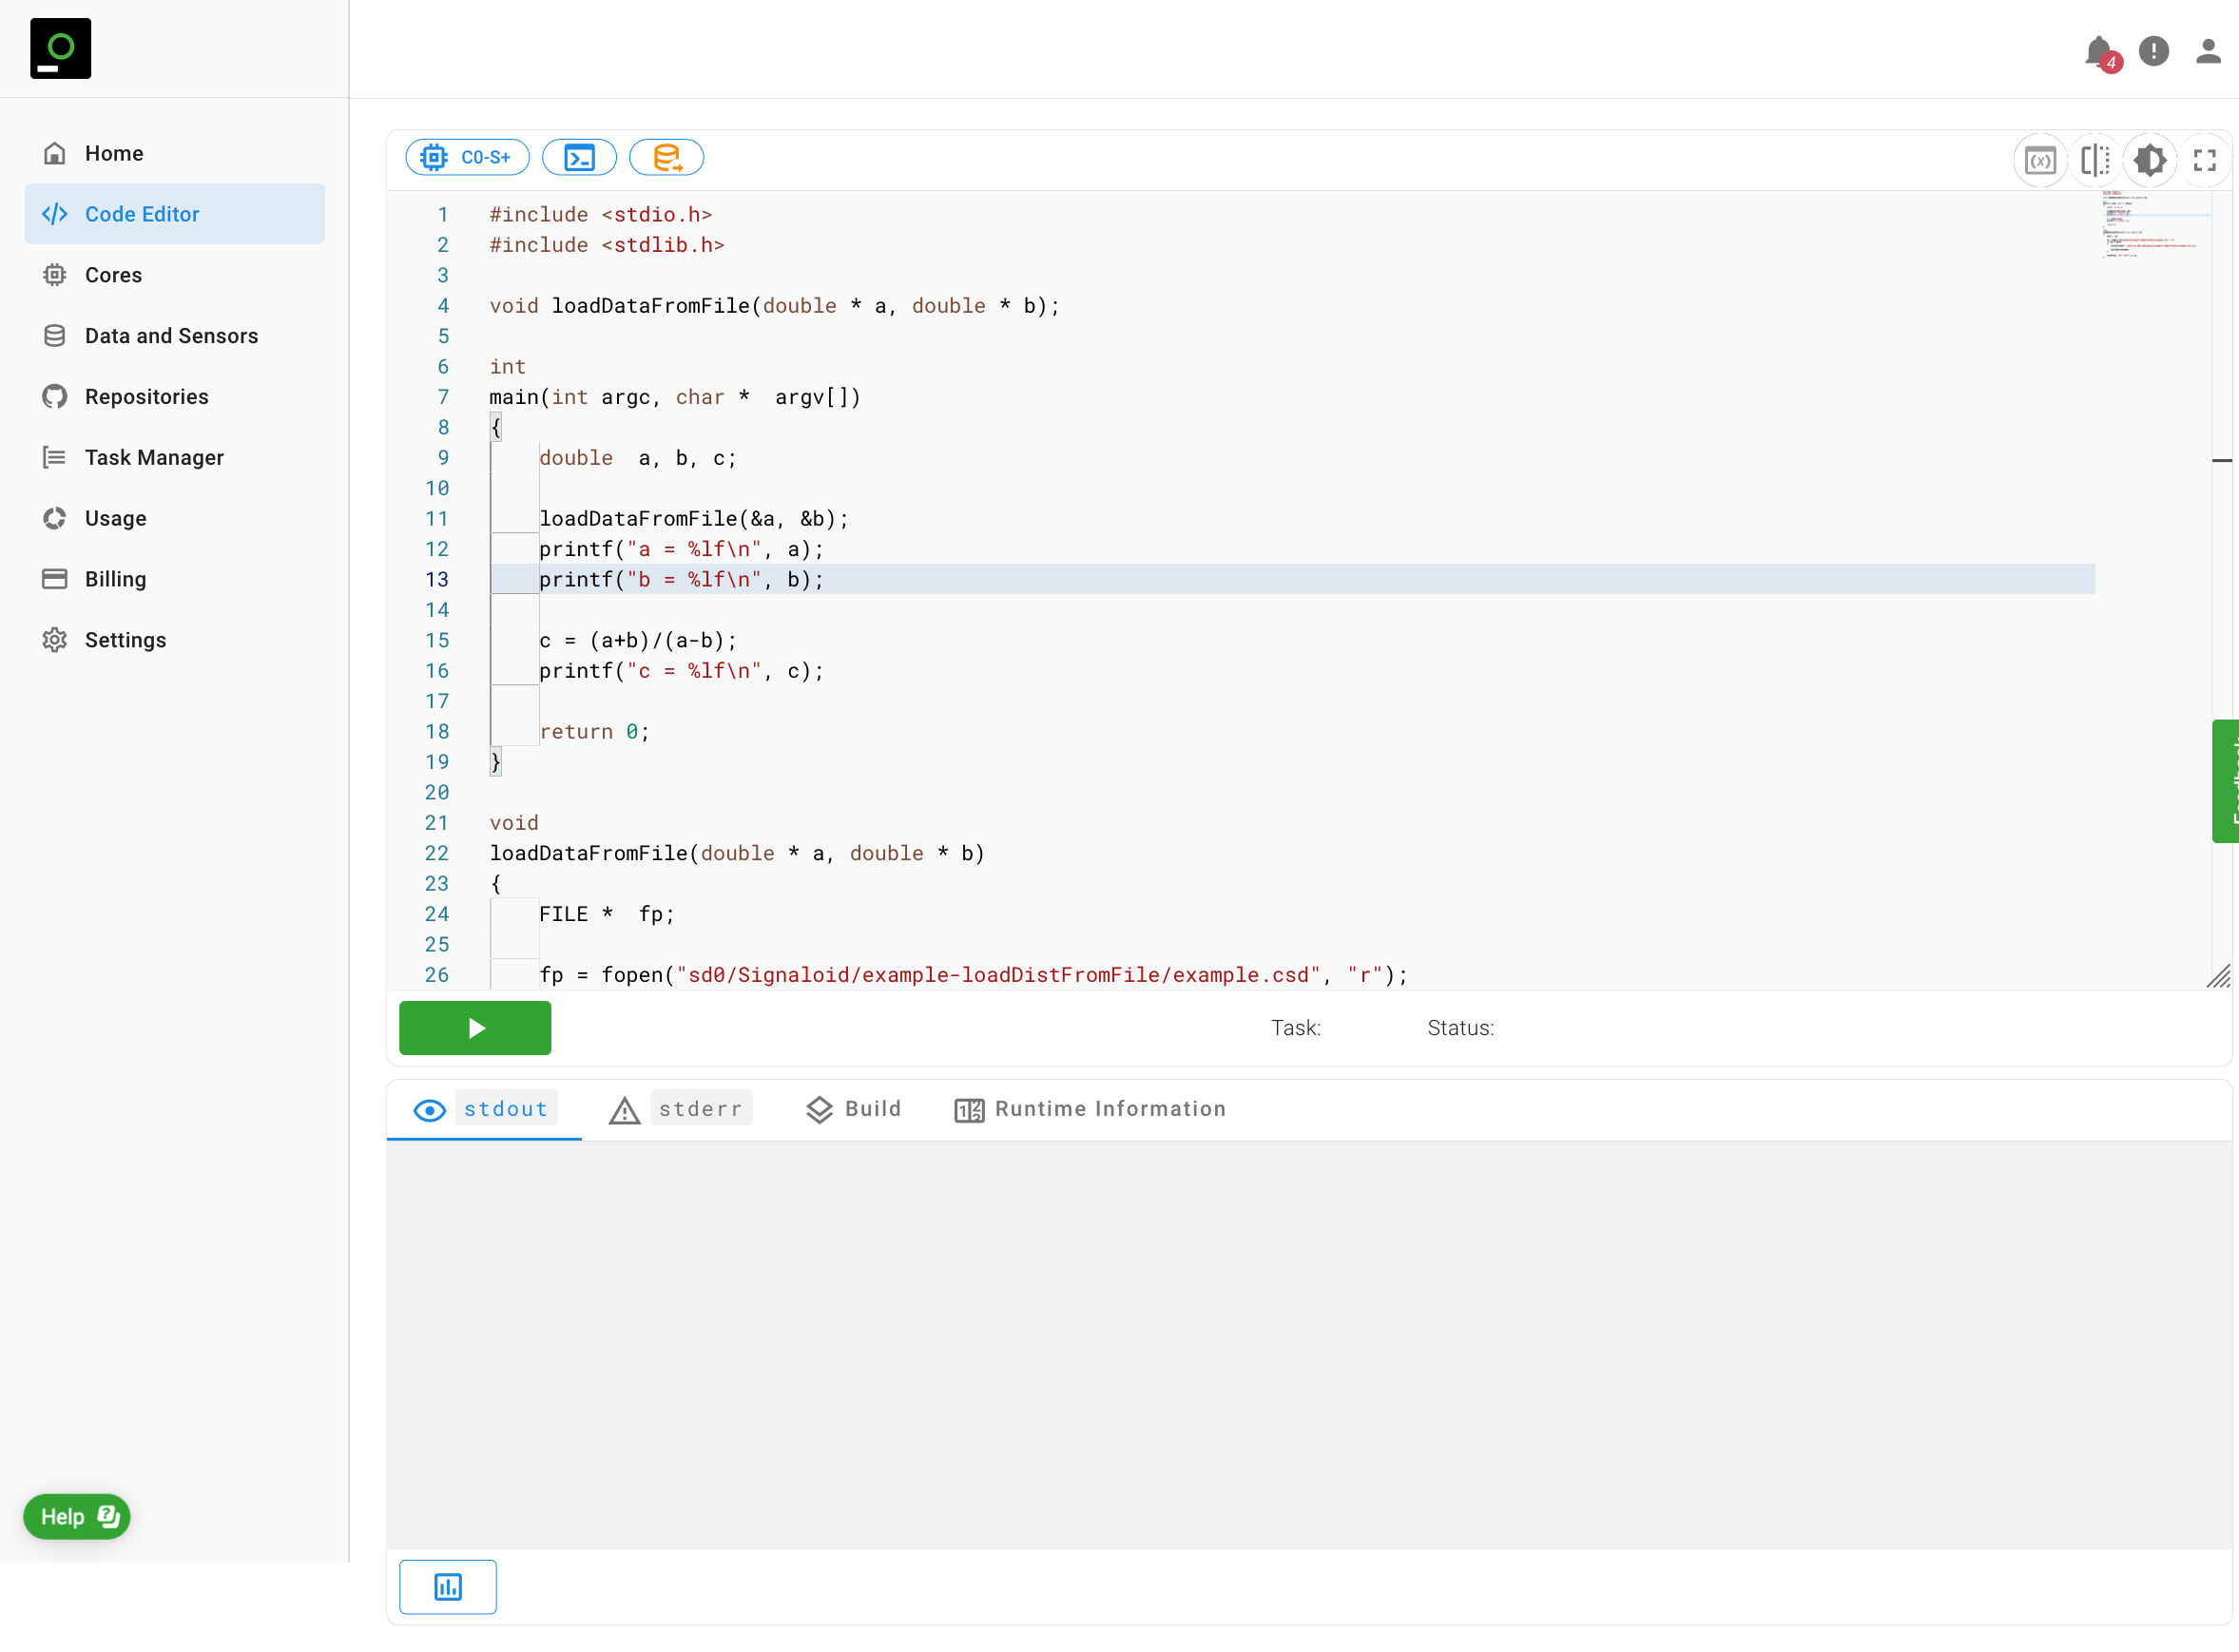
The page layout toggle button ( or ), switches the relative positioning of the Editor and Results Panel from above and below each other (default) to side-by-side. Figure 1 shows default layout of the Editor relative to the Results Panel. Figure 2 shows the side-by-side layout of the Editor relative to the Results Panel.
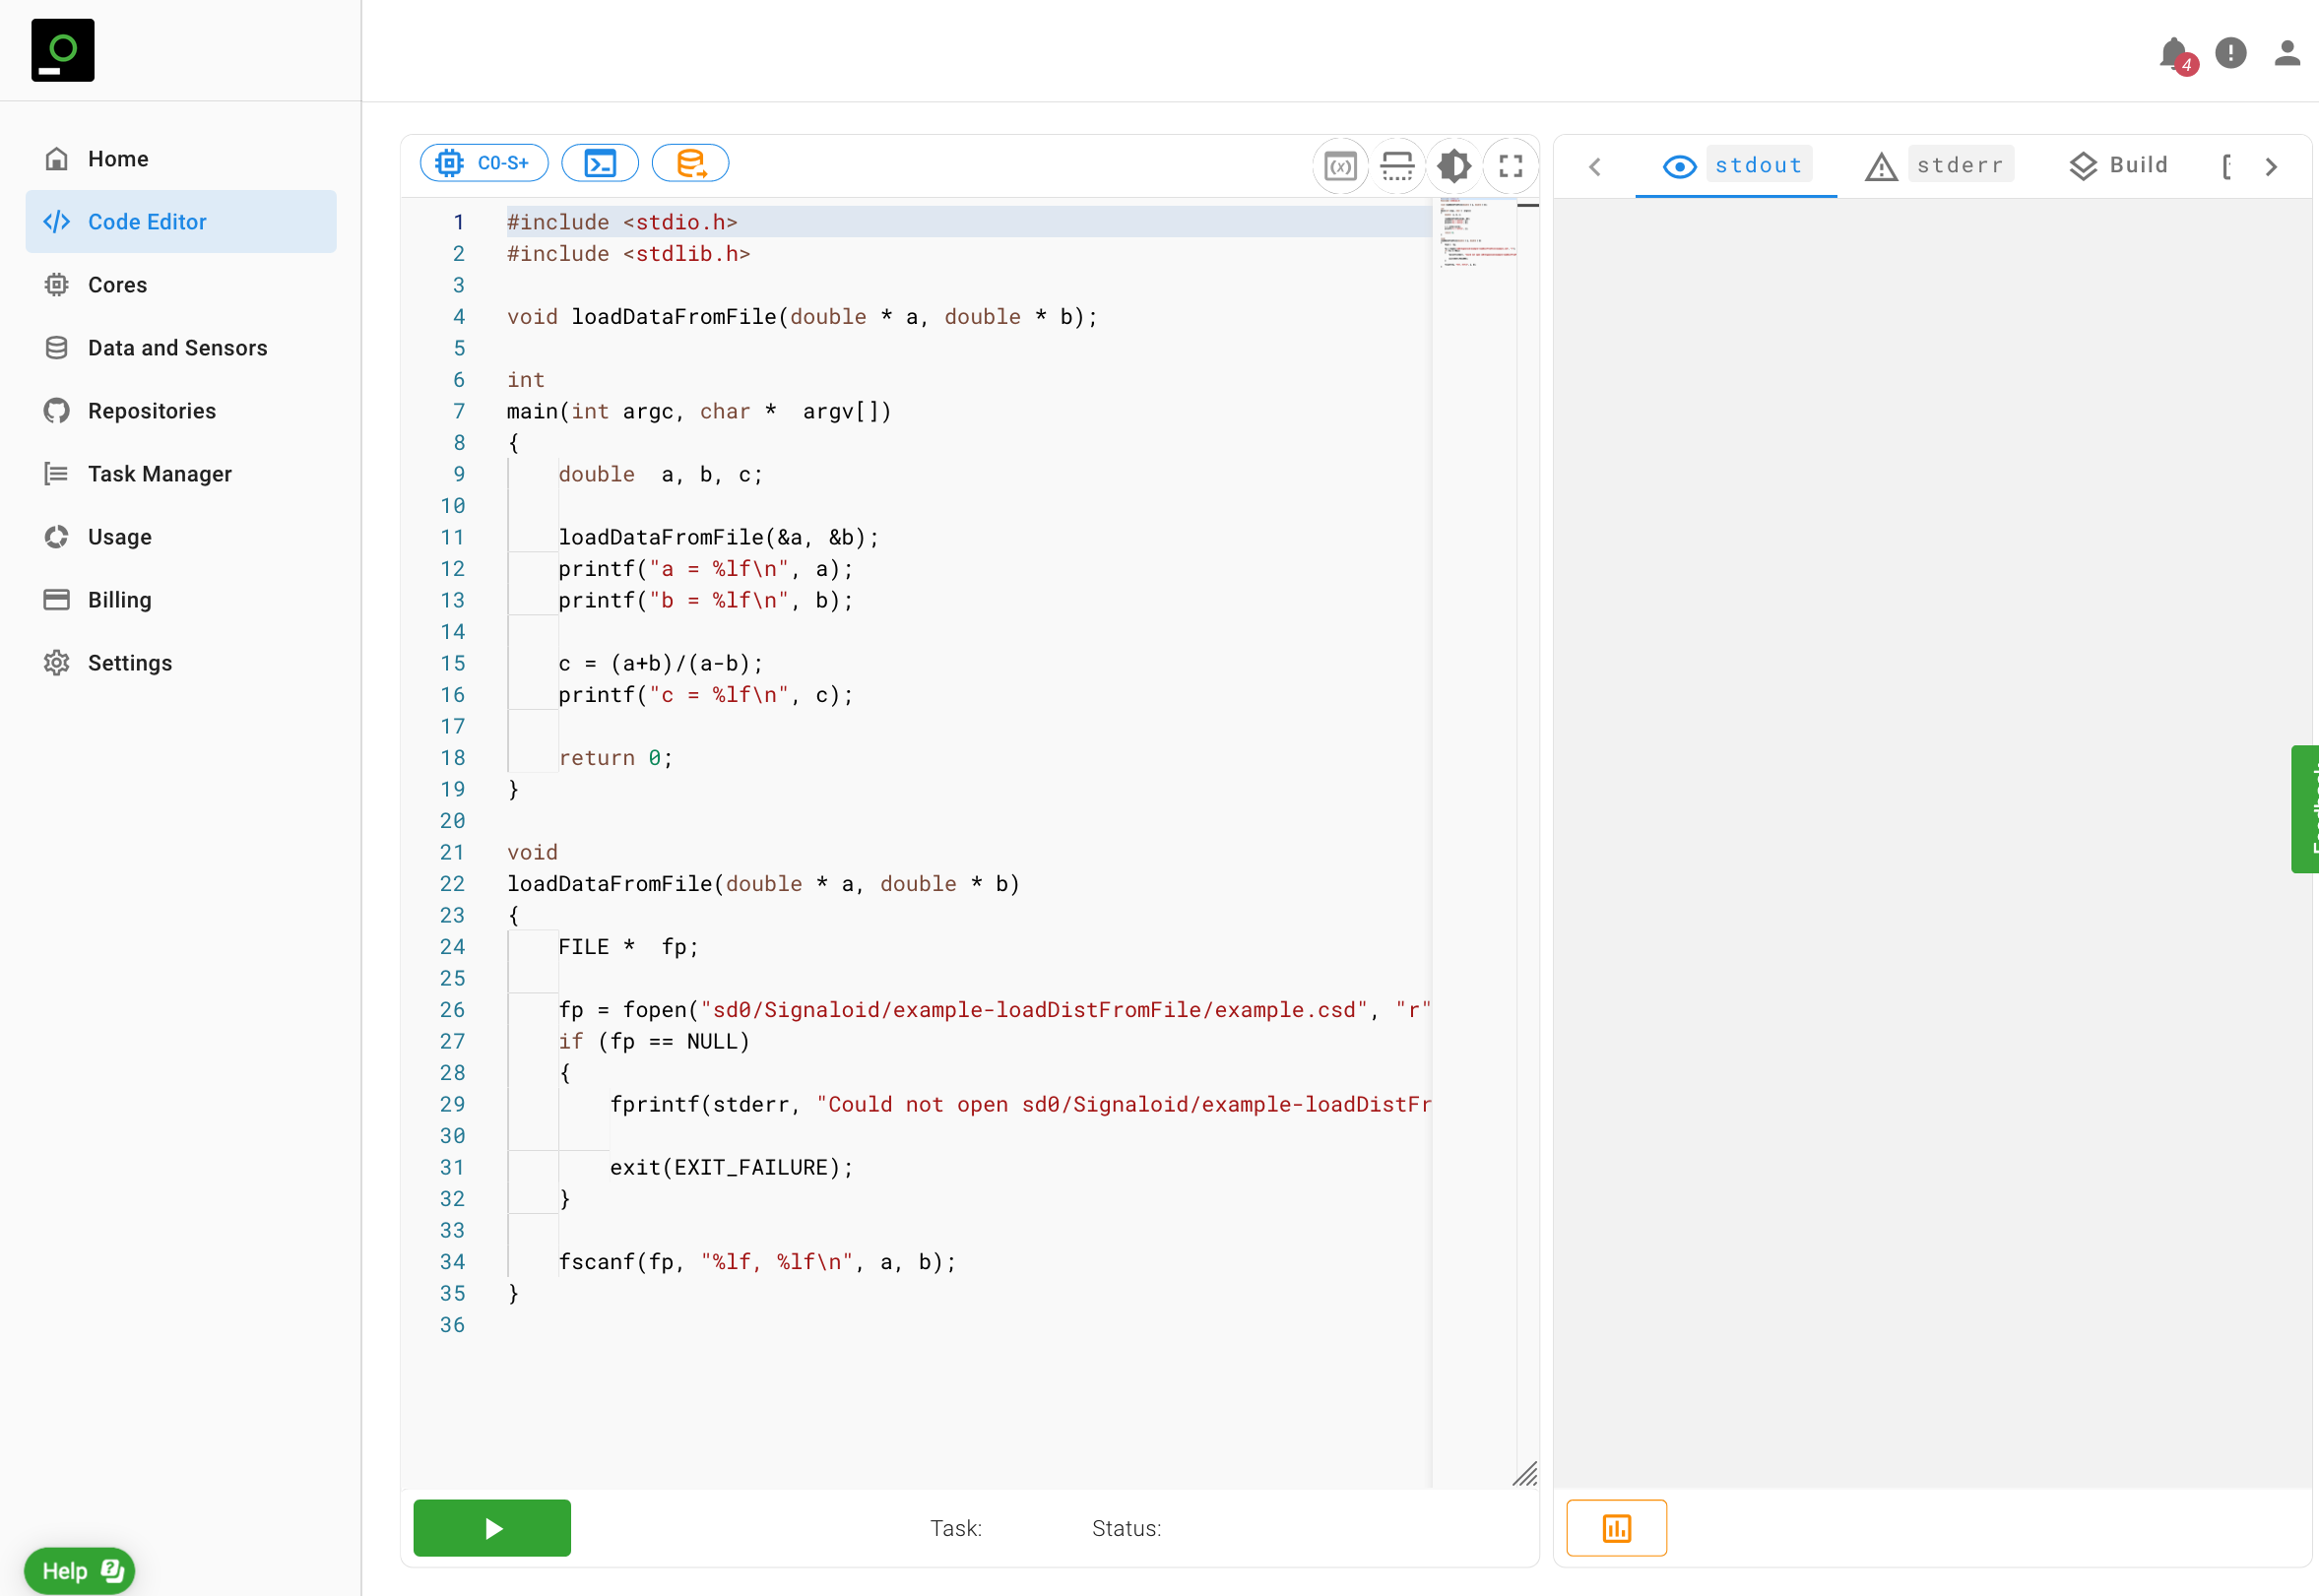
The full-screen button (), switches the Editor to full screen. Figure 3 shows the Editor in full-screen mode.
Theme
The editor theme toggle button (), switches the theme of the editor between three themes. Figure 4 shows one of the three default themes. You can further configure your default themes using the Settings page.
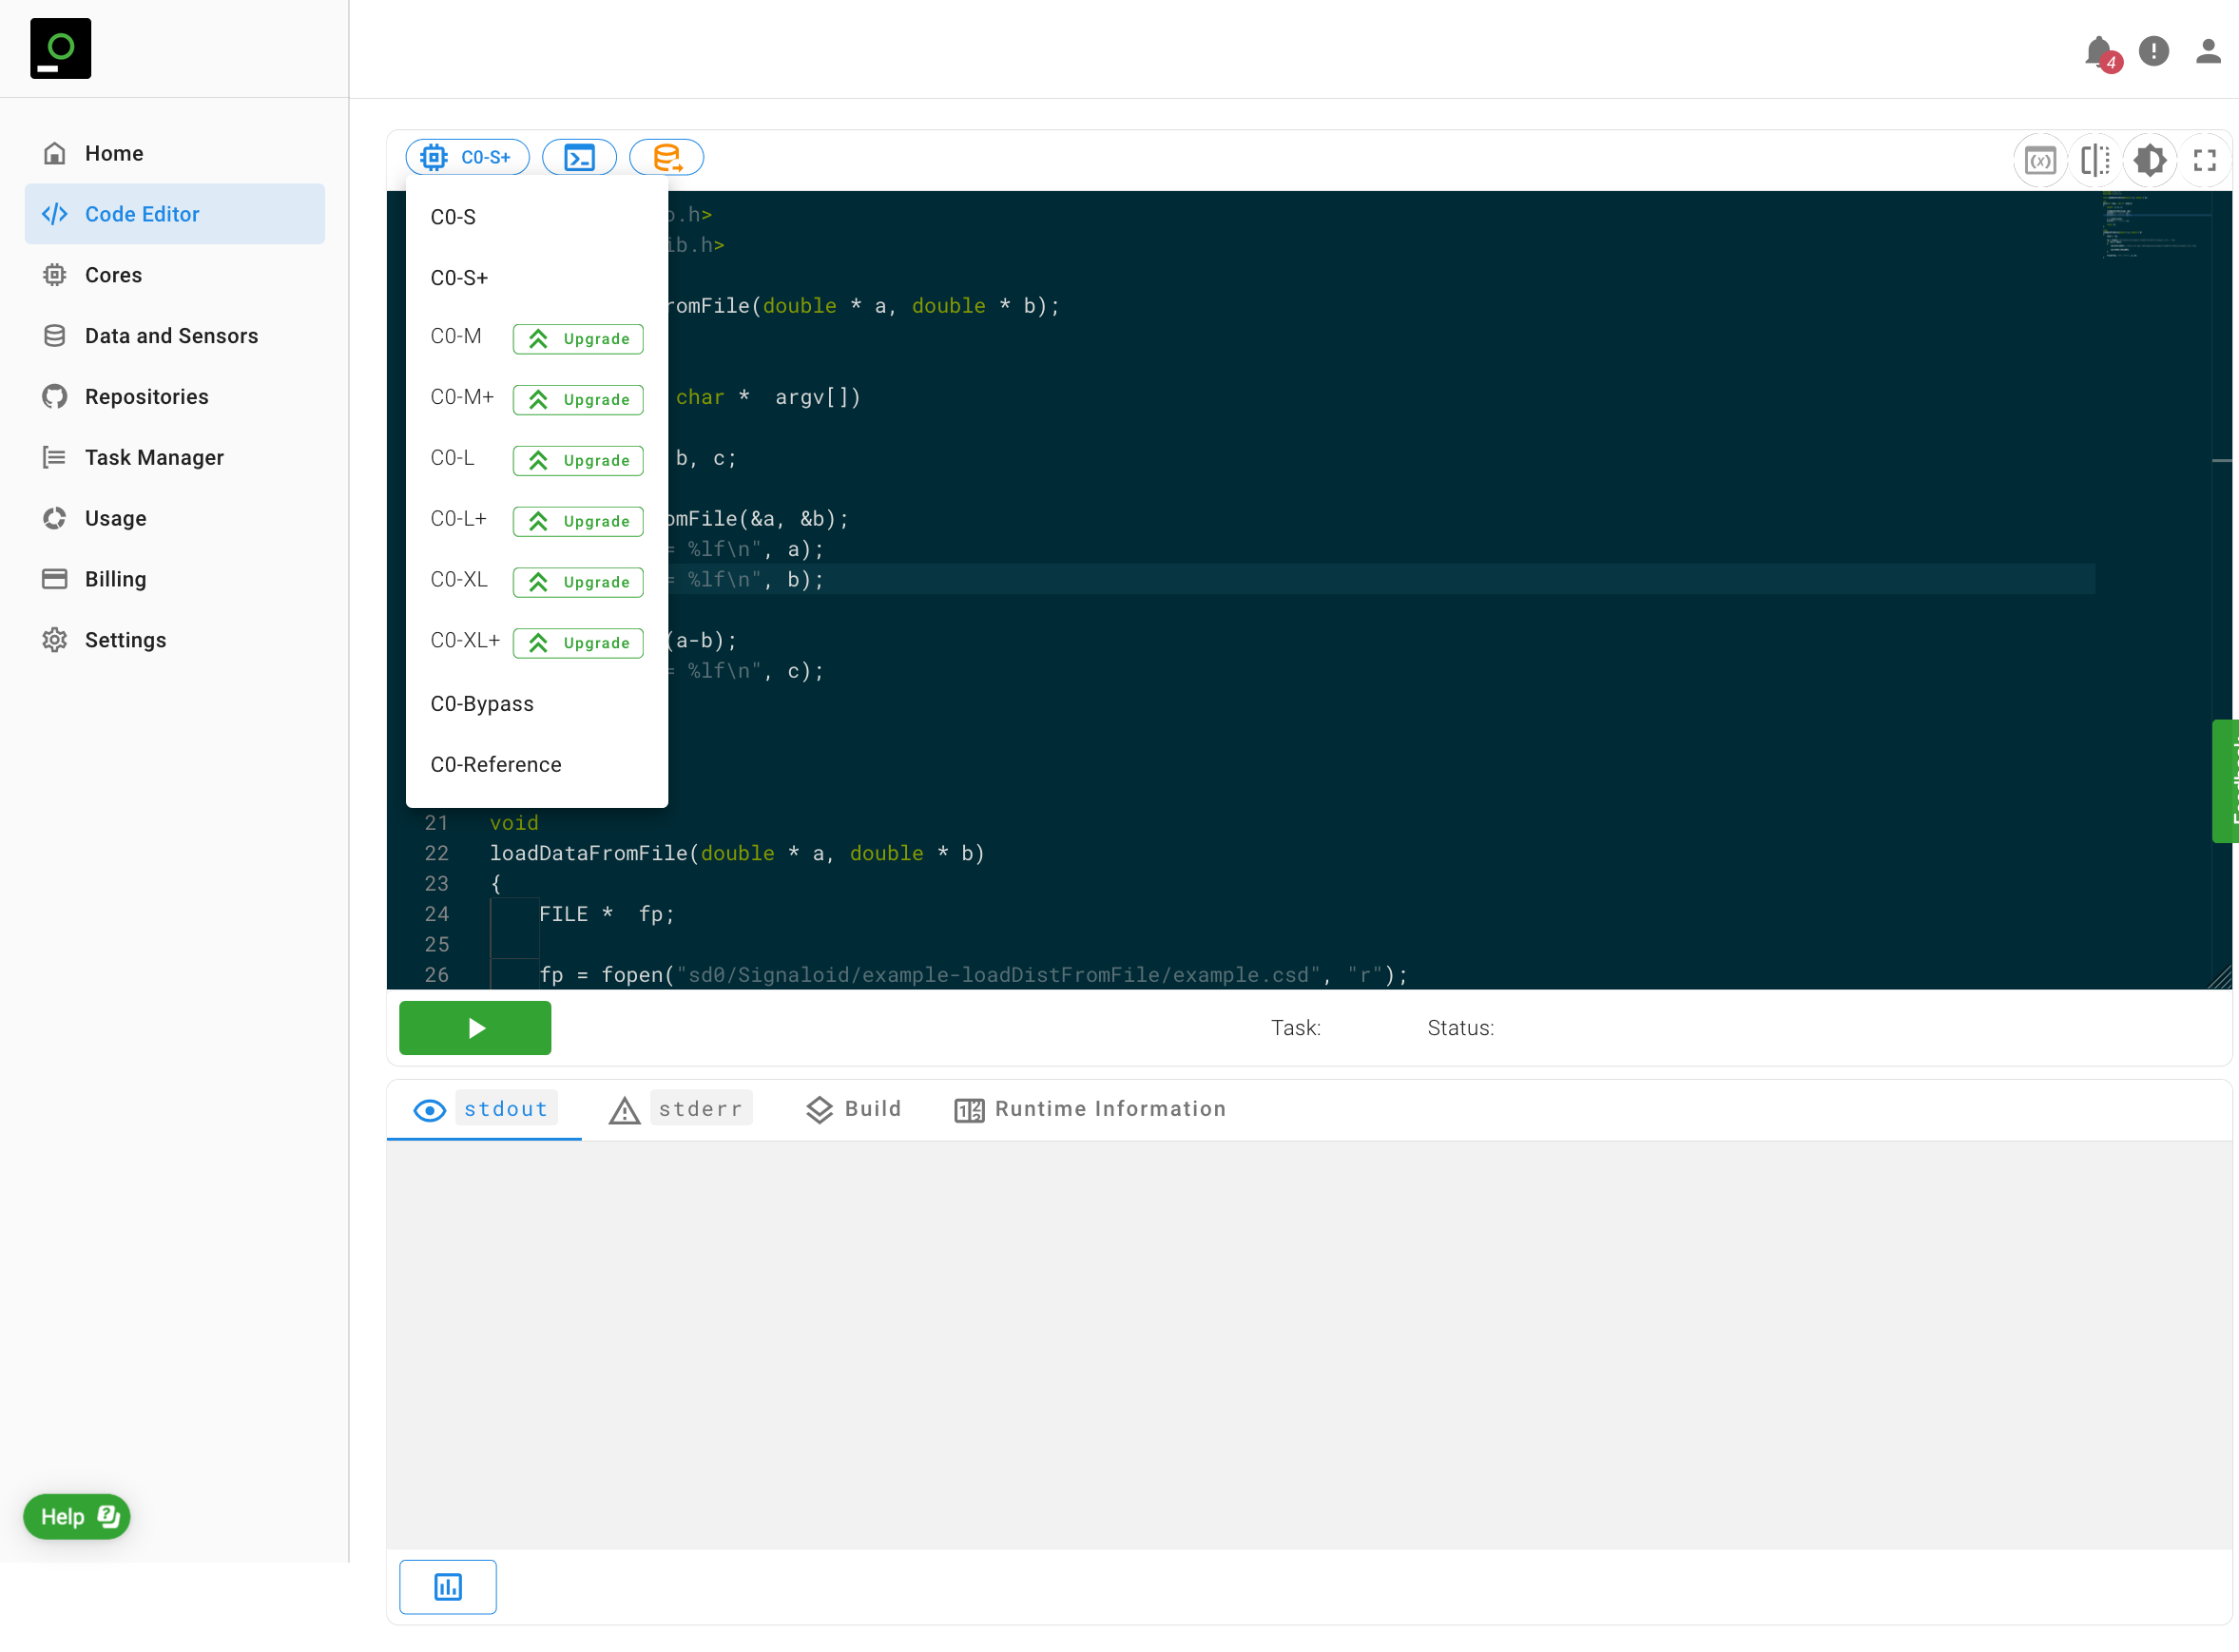
Execution Core Type
The Execution Core selection button (), allows you to set the Signaloid C0 processor core that you want to use to run the application on the Code Editor. You can select a core from your the list of your available C0 cores. See the Creating Custom Cores section for more information about your default Signaloid cores and how to create custom cores. Figure 5 shows the list of available Signaloid cores in the Free Tier.
Command-Line Arguments
The Command-Line Arguments button () allows you to set the command-line arguments of your application written in the Code Editor. The command line arguments follow the same convention as Unix programs, i.e., the first command-line arguments is the executed binary name. Figure 6 shows an example of command-line arguments that the Signaloid Cloud Developer Platform will pass to your application when it runs on a Signaloid C0 core.
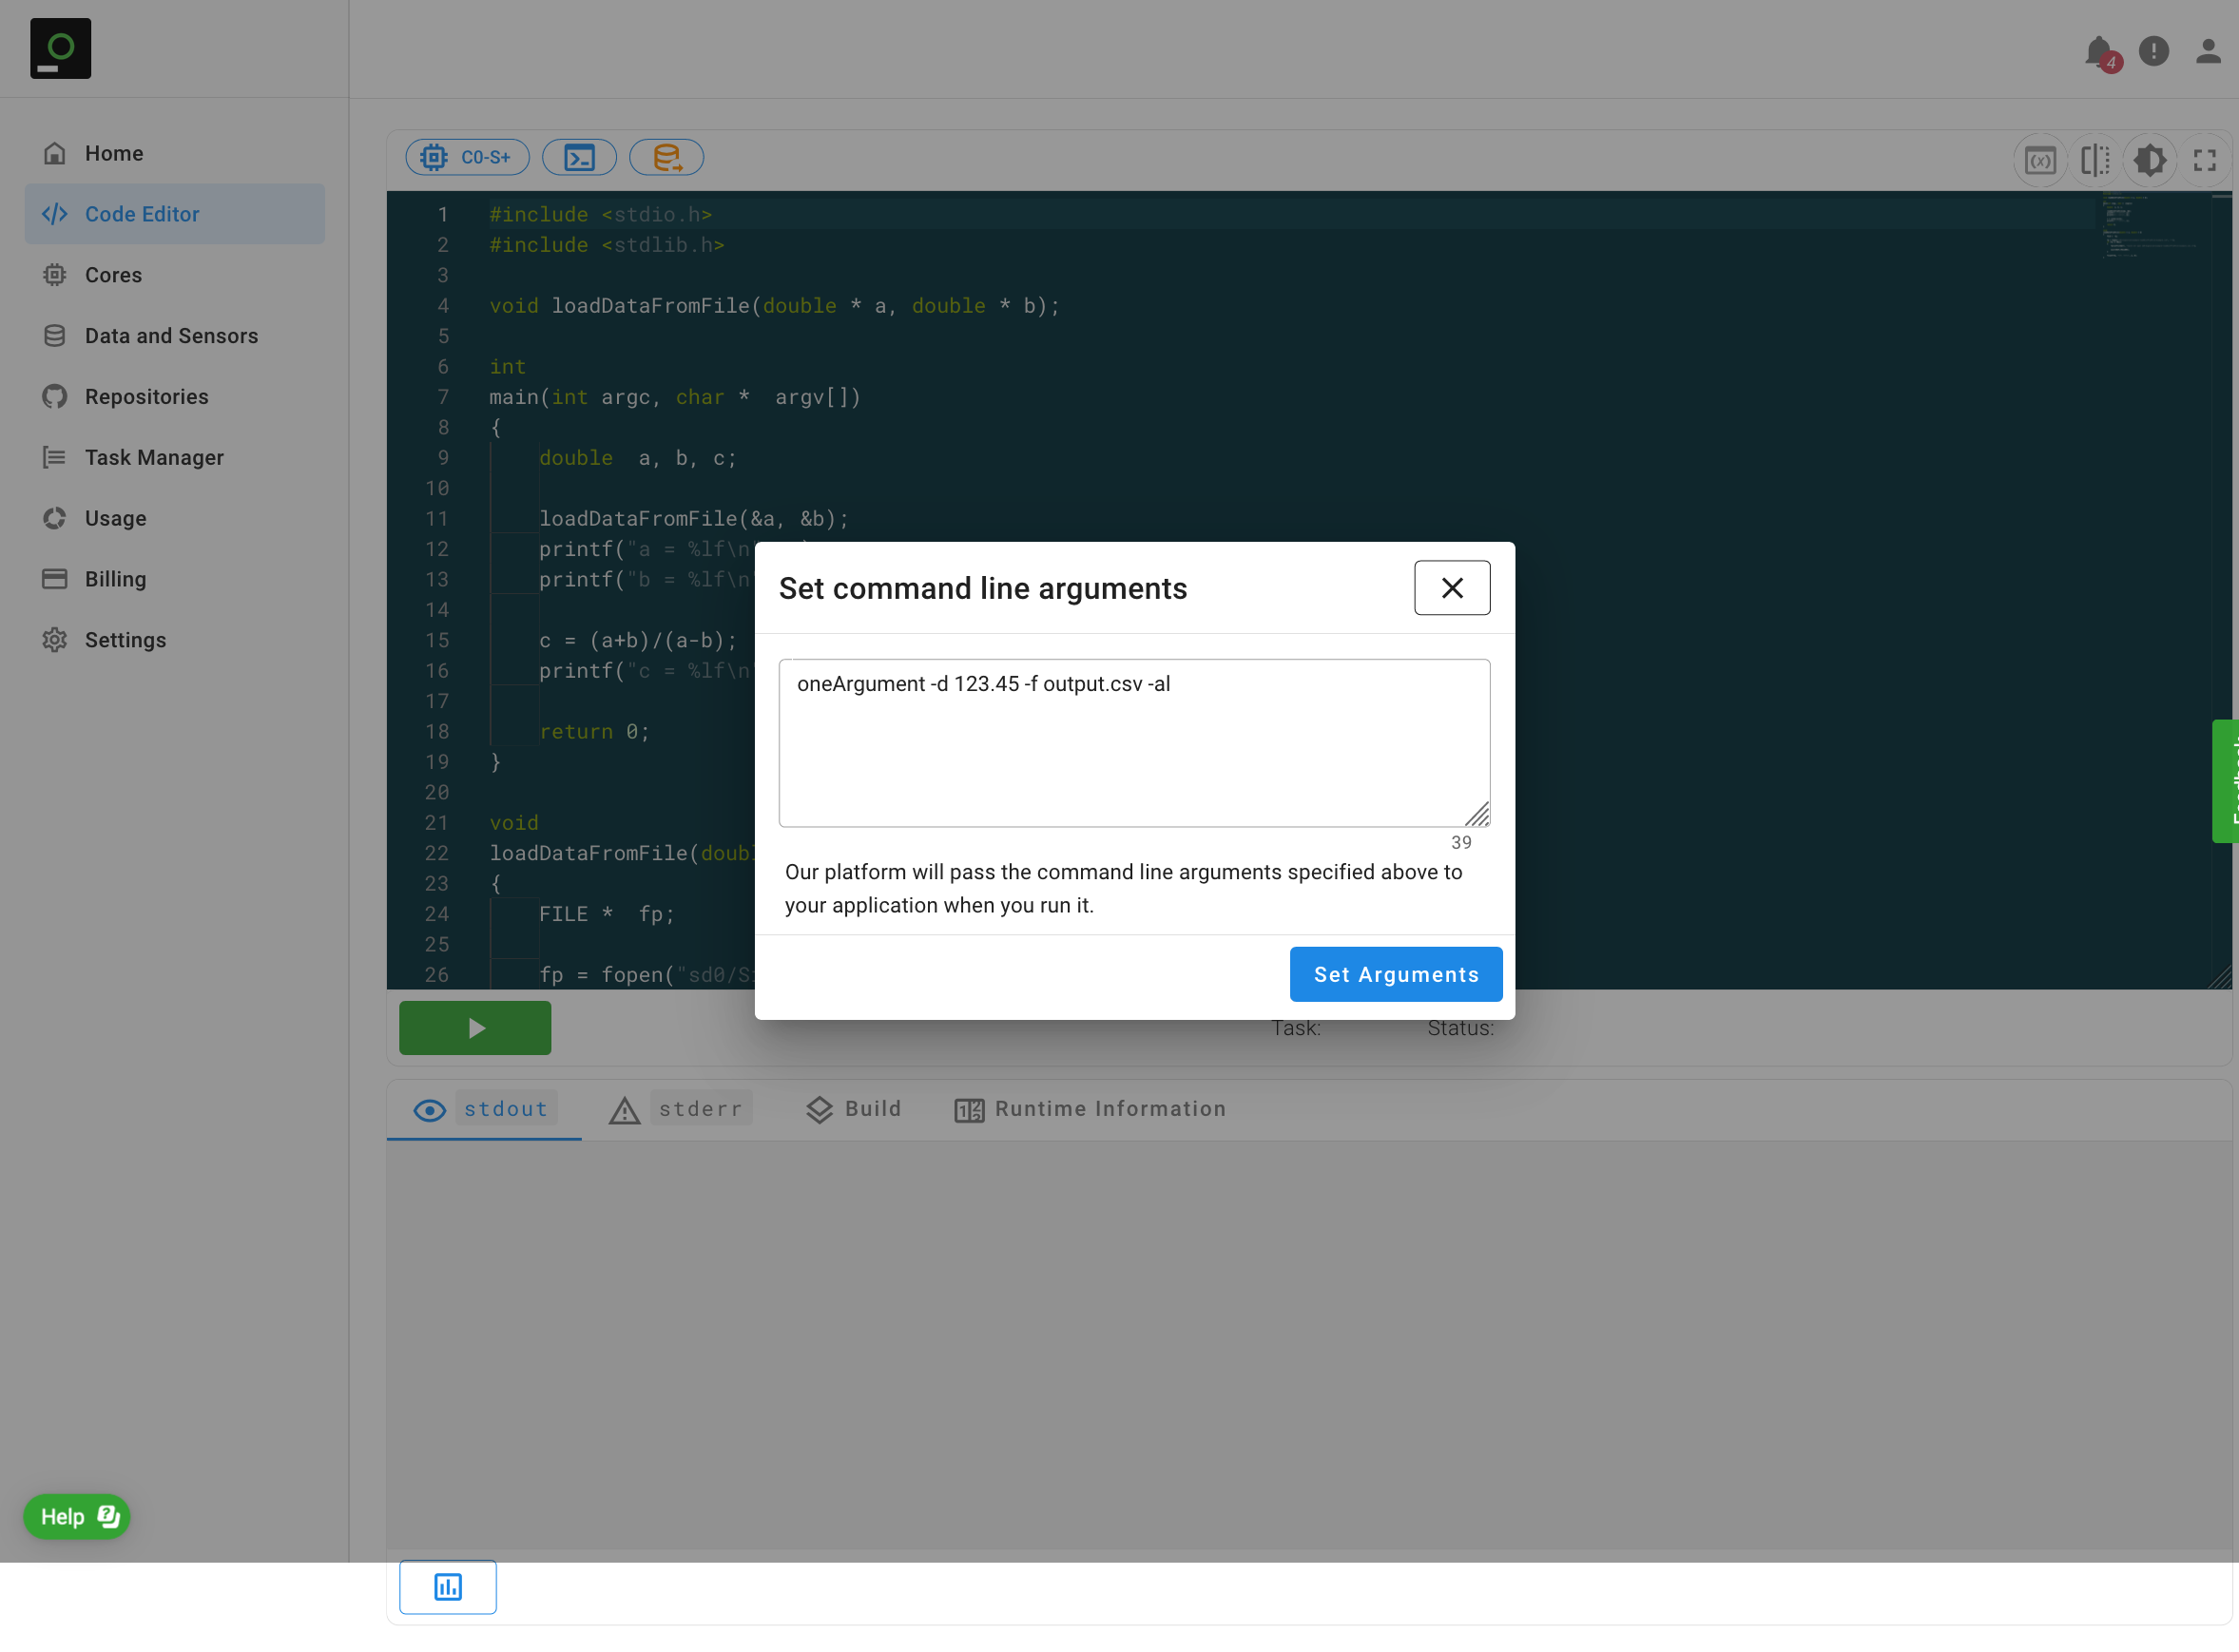
The Signaloid Cloud Developer Platform stores the command-line arguments and uses them in all follow-up Task executions from the Code Editor page. To reset the command-line arguments, open the dialog again, remove your entries from the text area, and press the Set Arguments button.
The Signaloid Cloud Compute Engine does not support quoting arguments that contain spaces to create a single argument.
In other words, if you set the command-line argument text area to arg1 "arg2p1 arg2p2", the compute engine will treat
"arg2p1 and arg2p2" as two separate arguments.
Data Storage Layout
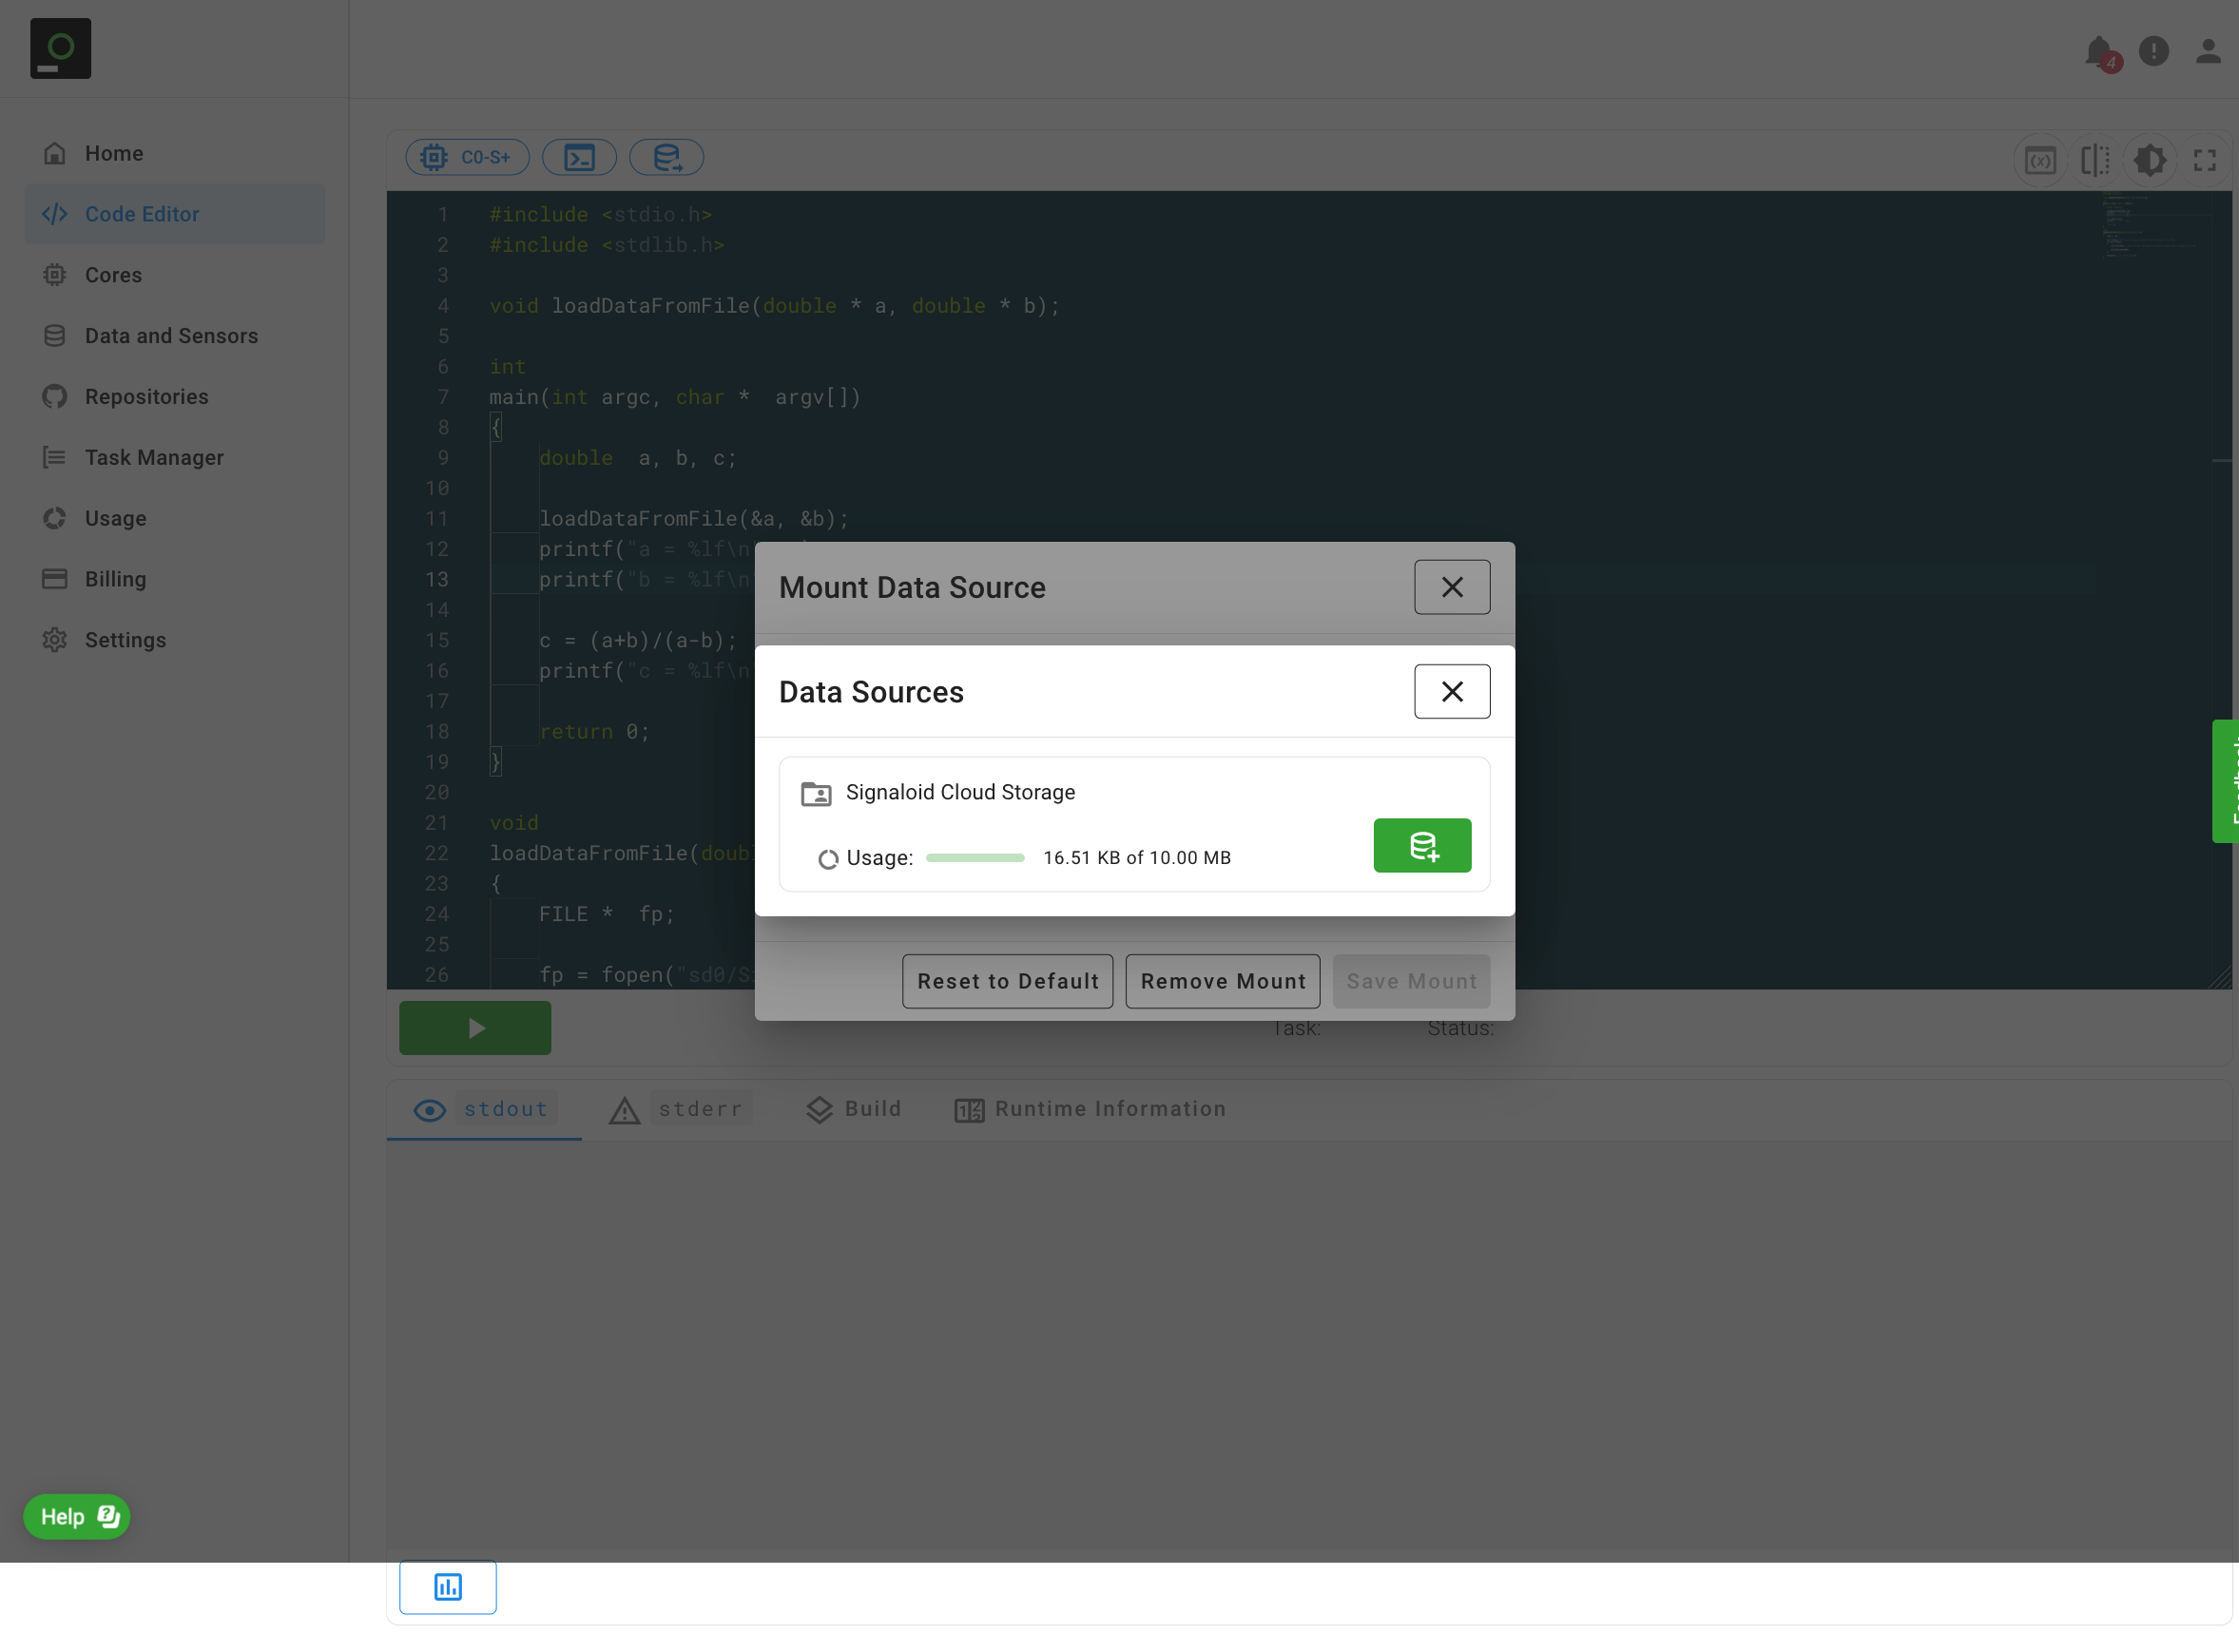
The Mount Data Source button () allows you to mount data sources that your application can access during its execution on a Signaloid C0 core. To mount a data source, first click on the Mount Data Source button. Figure 7 shows the "Mount Data Source" window which appears once you click on the Mount Data Source button. Clicking on "Select Data Source" allows you to select one of your available data sources.
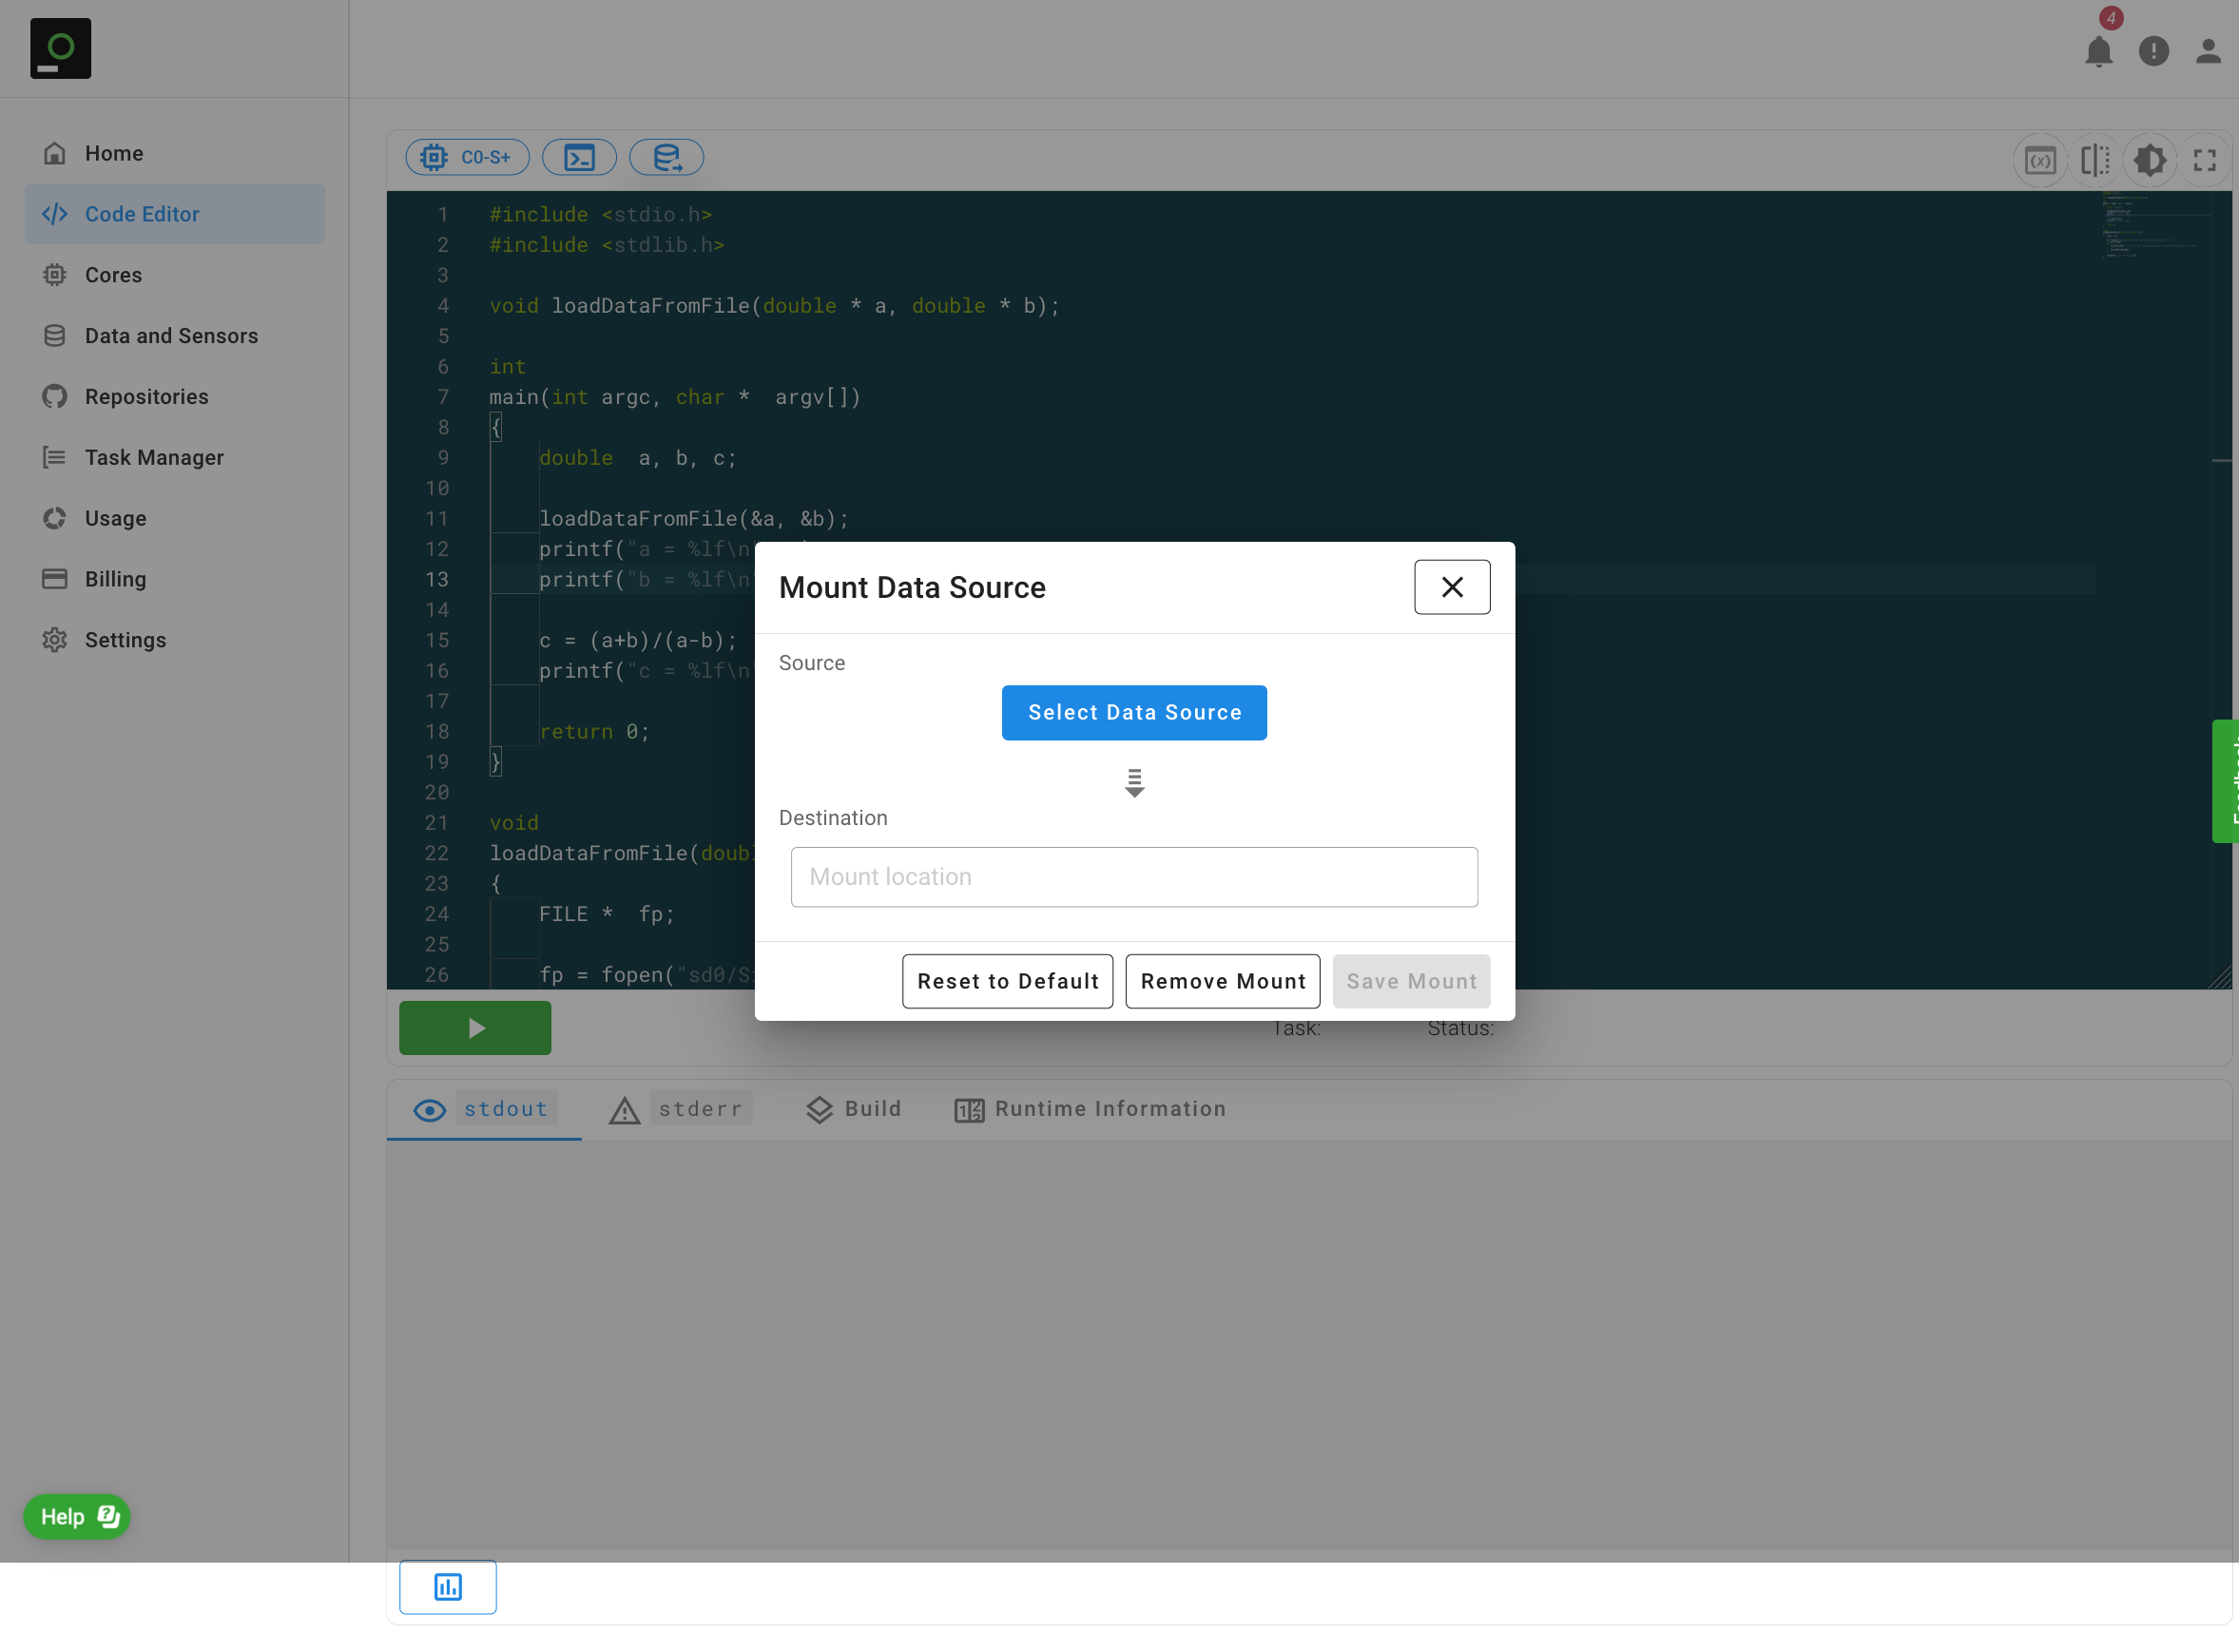
Figure 8 shows the modal dialog window that appears when you click on the "Select Data Source" button. Click on the "Mount Data Source" () button to select a data source. In the example of Figure 8 we select the Signaloid Cloud Storage, which is available to all Signaloid user accounts.
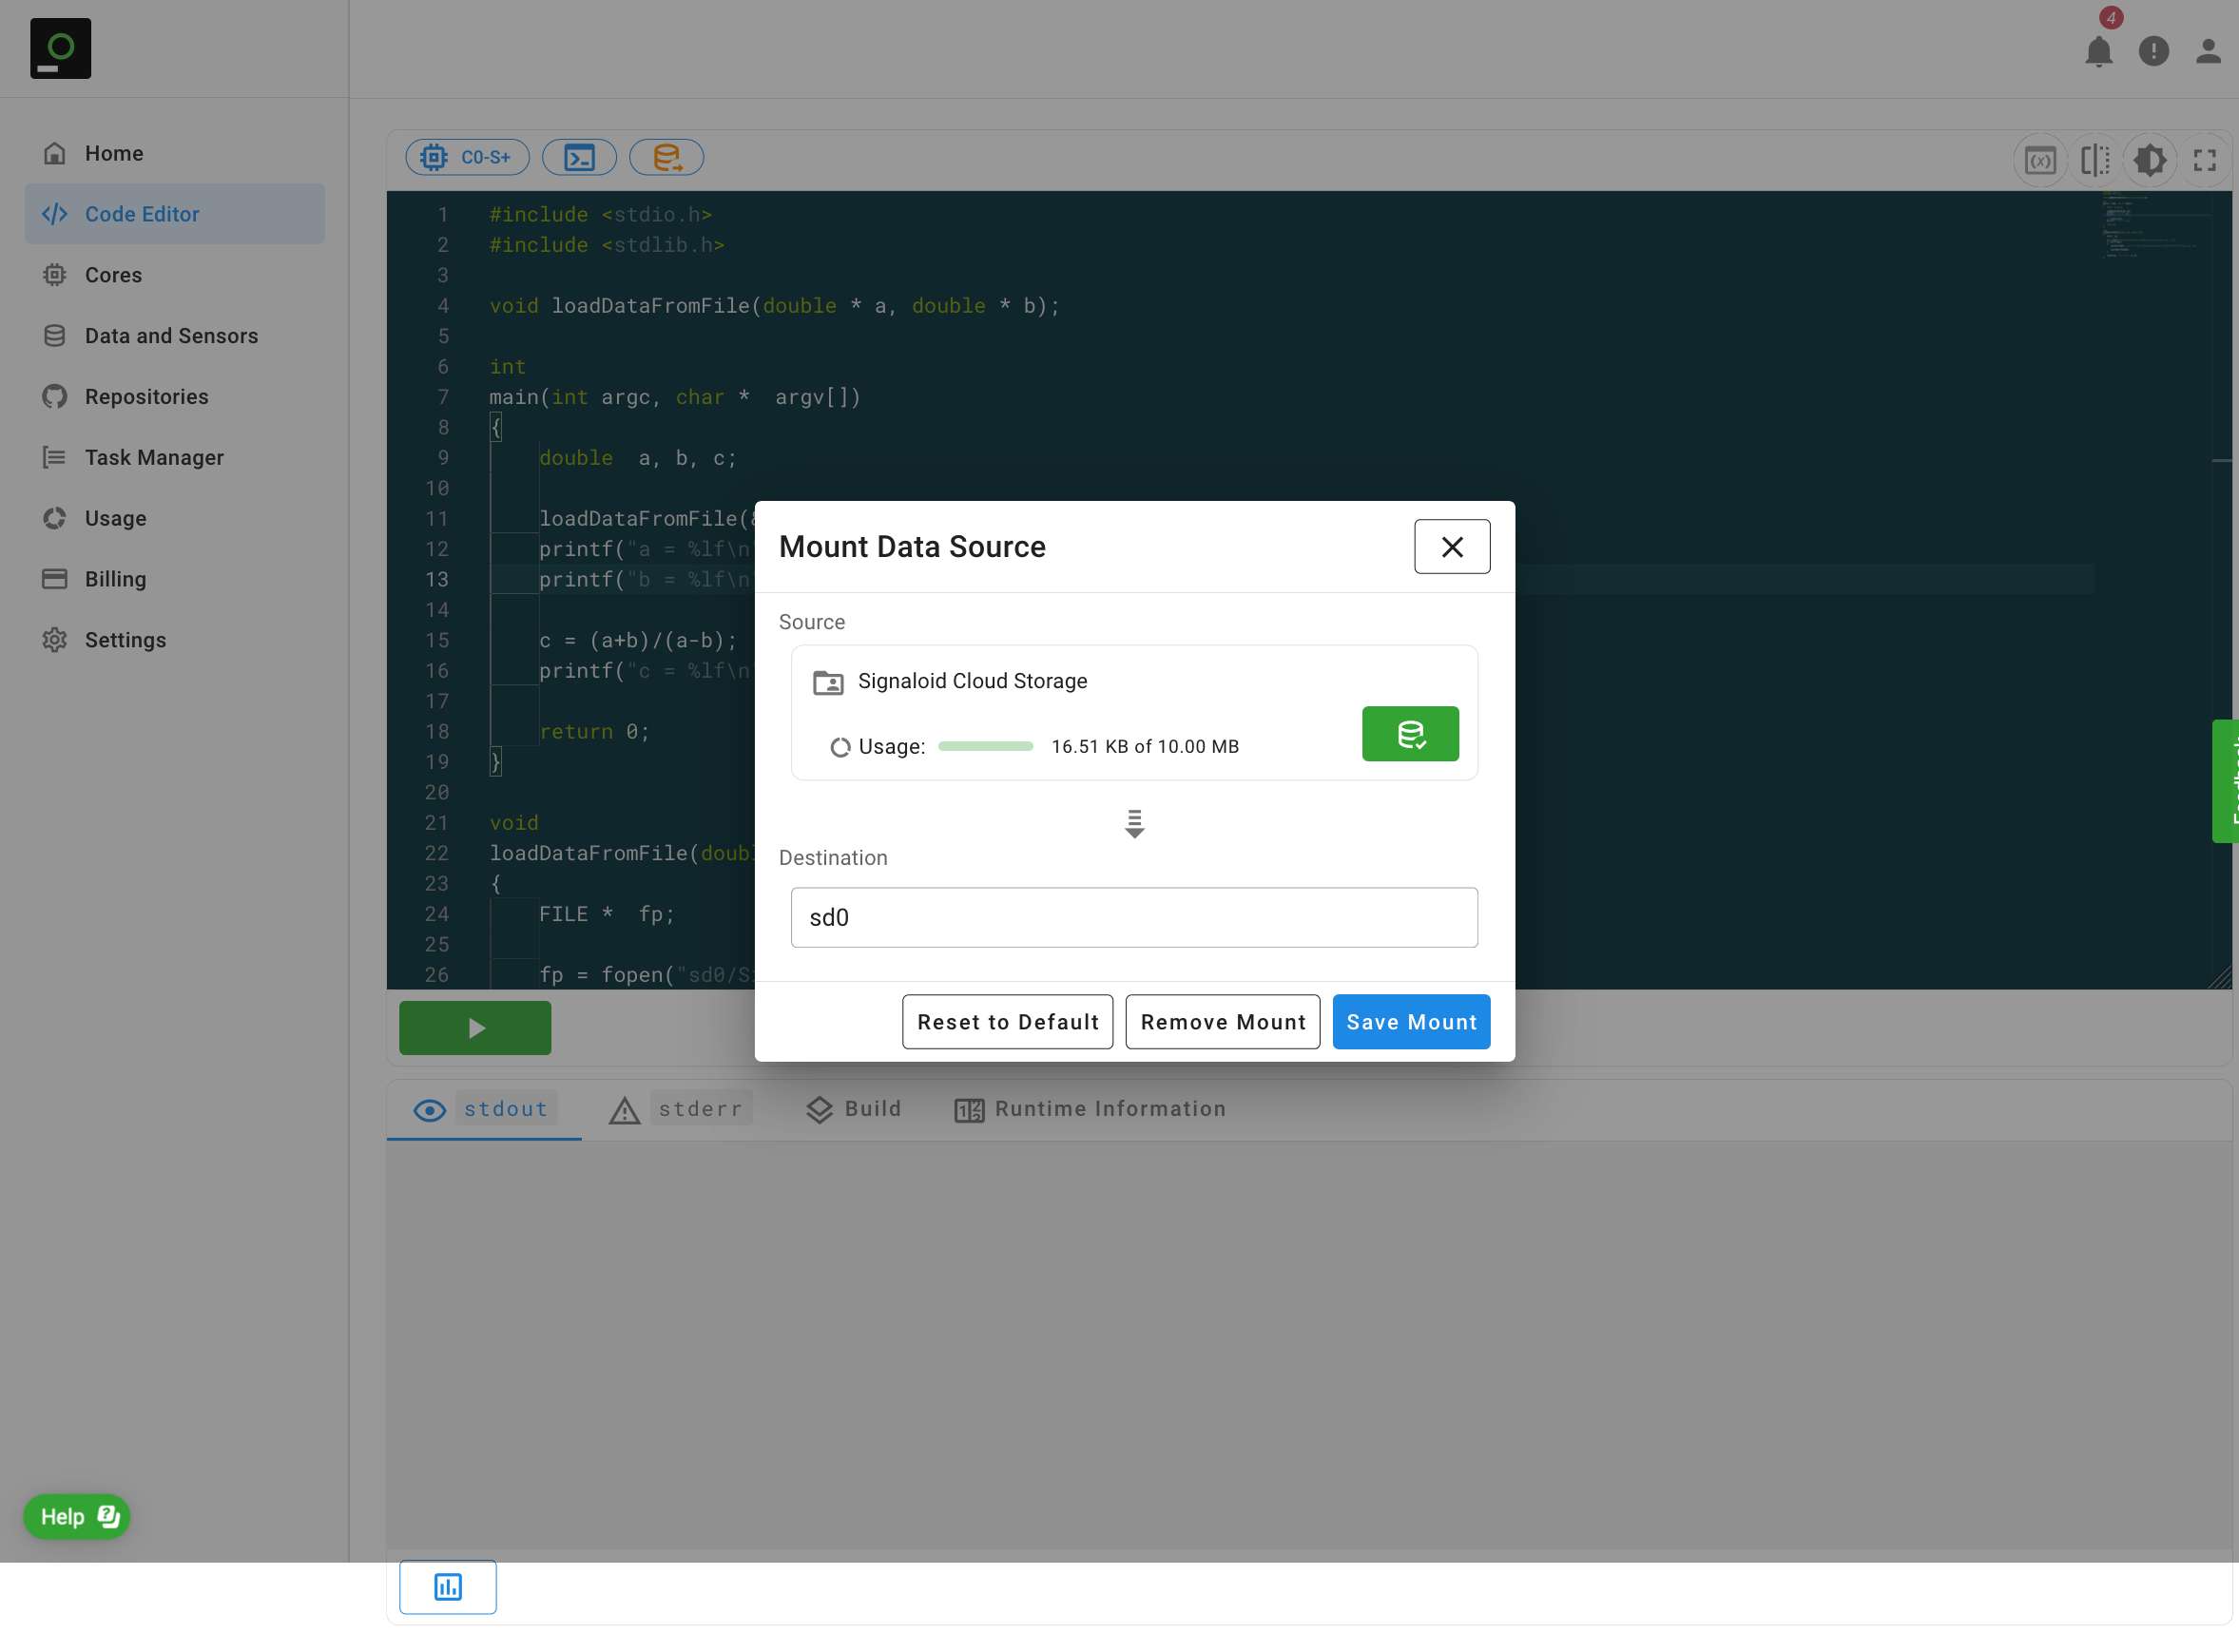
Selecting a data source takes you back to the Mount Data Source window. Then, enter the mount location destination
of your selected data source, which is the root path for your application to access your data source. Figure 7 shows
an example setting of the mount point to sd0. You need to click on the "Save Mount" button to complete
the mounting process. The Signaloid Cloud Developer Platform highlights a complete mount by making the "Mount Data Source" icon orange.
In the "Mount Data Source" window, clicking on the "Reset to Default" button will mount your default mount configuration as defined in the Settings page.
Clicking on the "Remove Mount" button will unmount any mounted data sources for you application.
Writing Code
You can code and run your C source code applications in the Code Editor.
The Signaloid Cloud Developer Platform stores your source code changes and reloads your source code whenever you access the Code Editor.
Click the "Compile and Run" button () button to build and run the source code in the Code Editor.
The Signaloid Cloud Developer Platform will show the compilation warnings and errors of your source code in the build tab of the Results Panel.
During execution, if the inputs to your program are appropriately encoded with uncertainty
information, then even with no modifications to your source code, the Signaloid Cloud Developer Platform will track the evolution
of the uncertainty associated with every value consumed or produced by your program, during its execution.
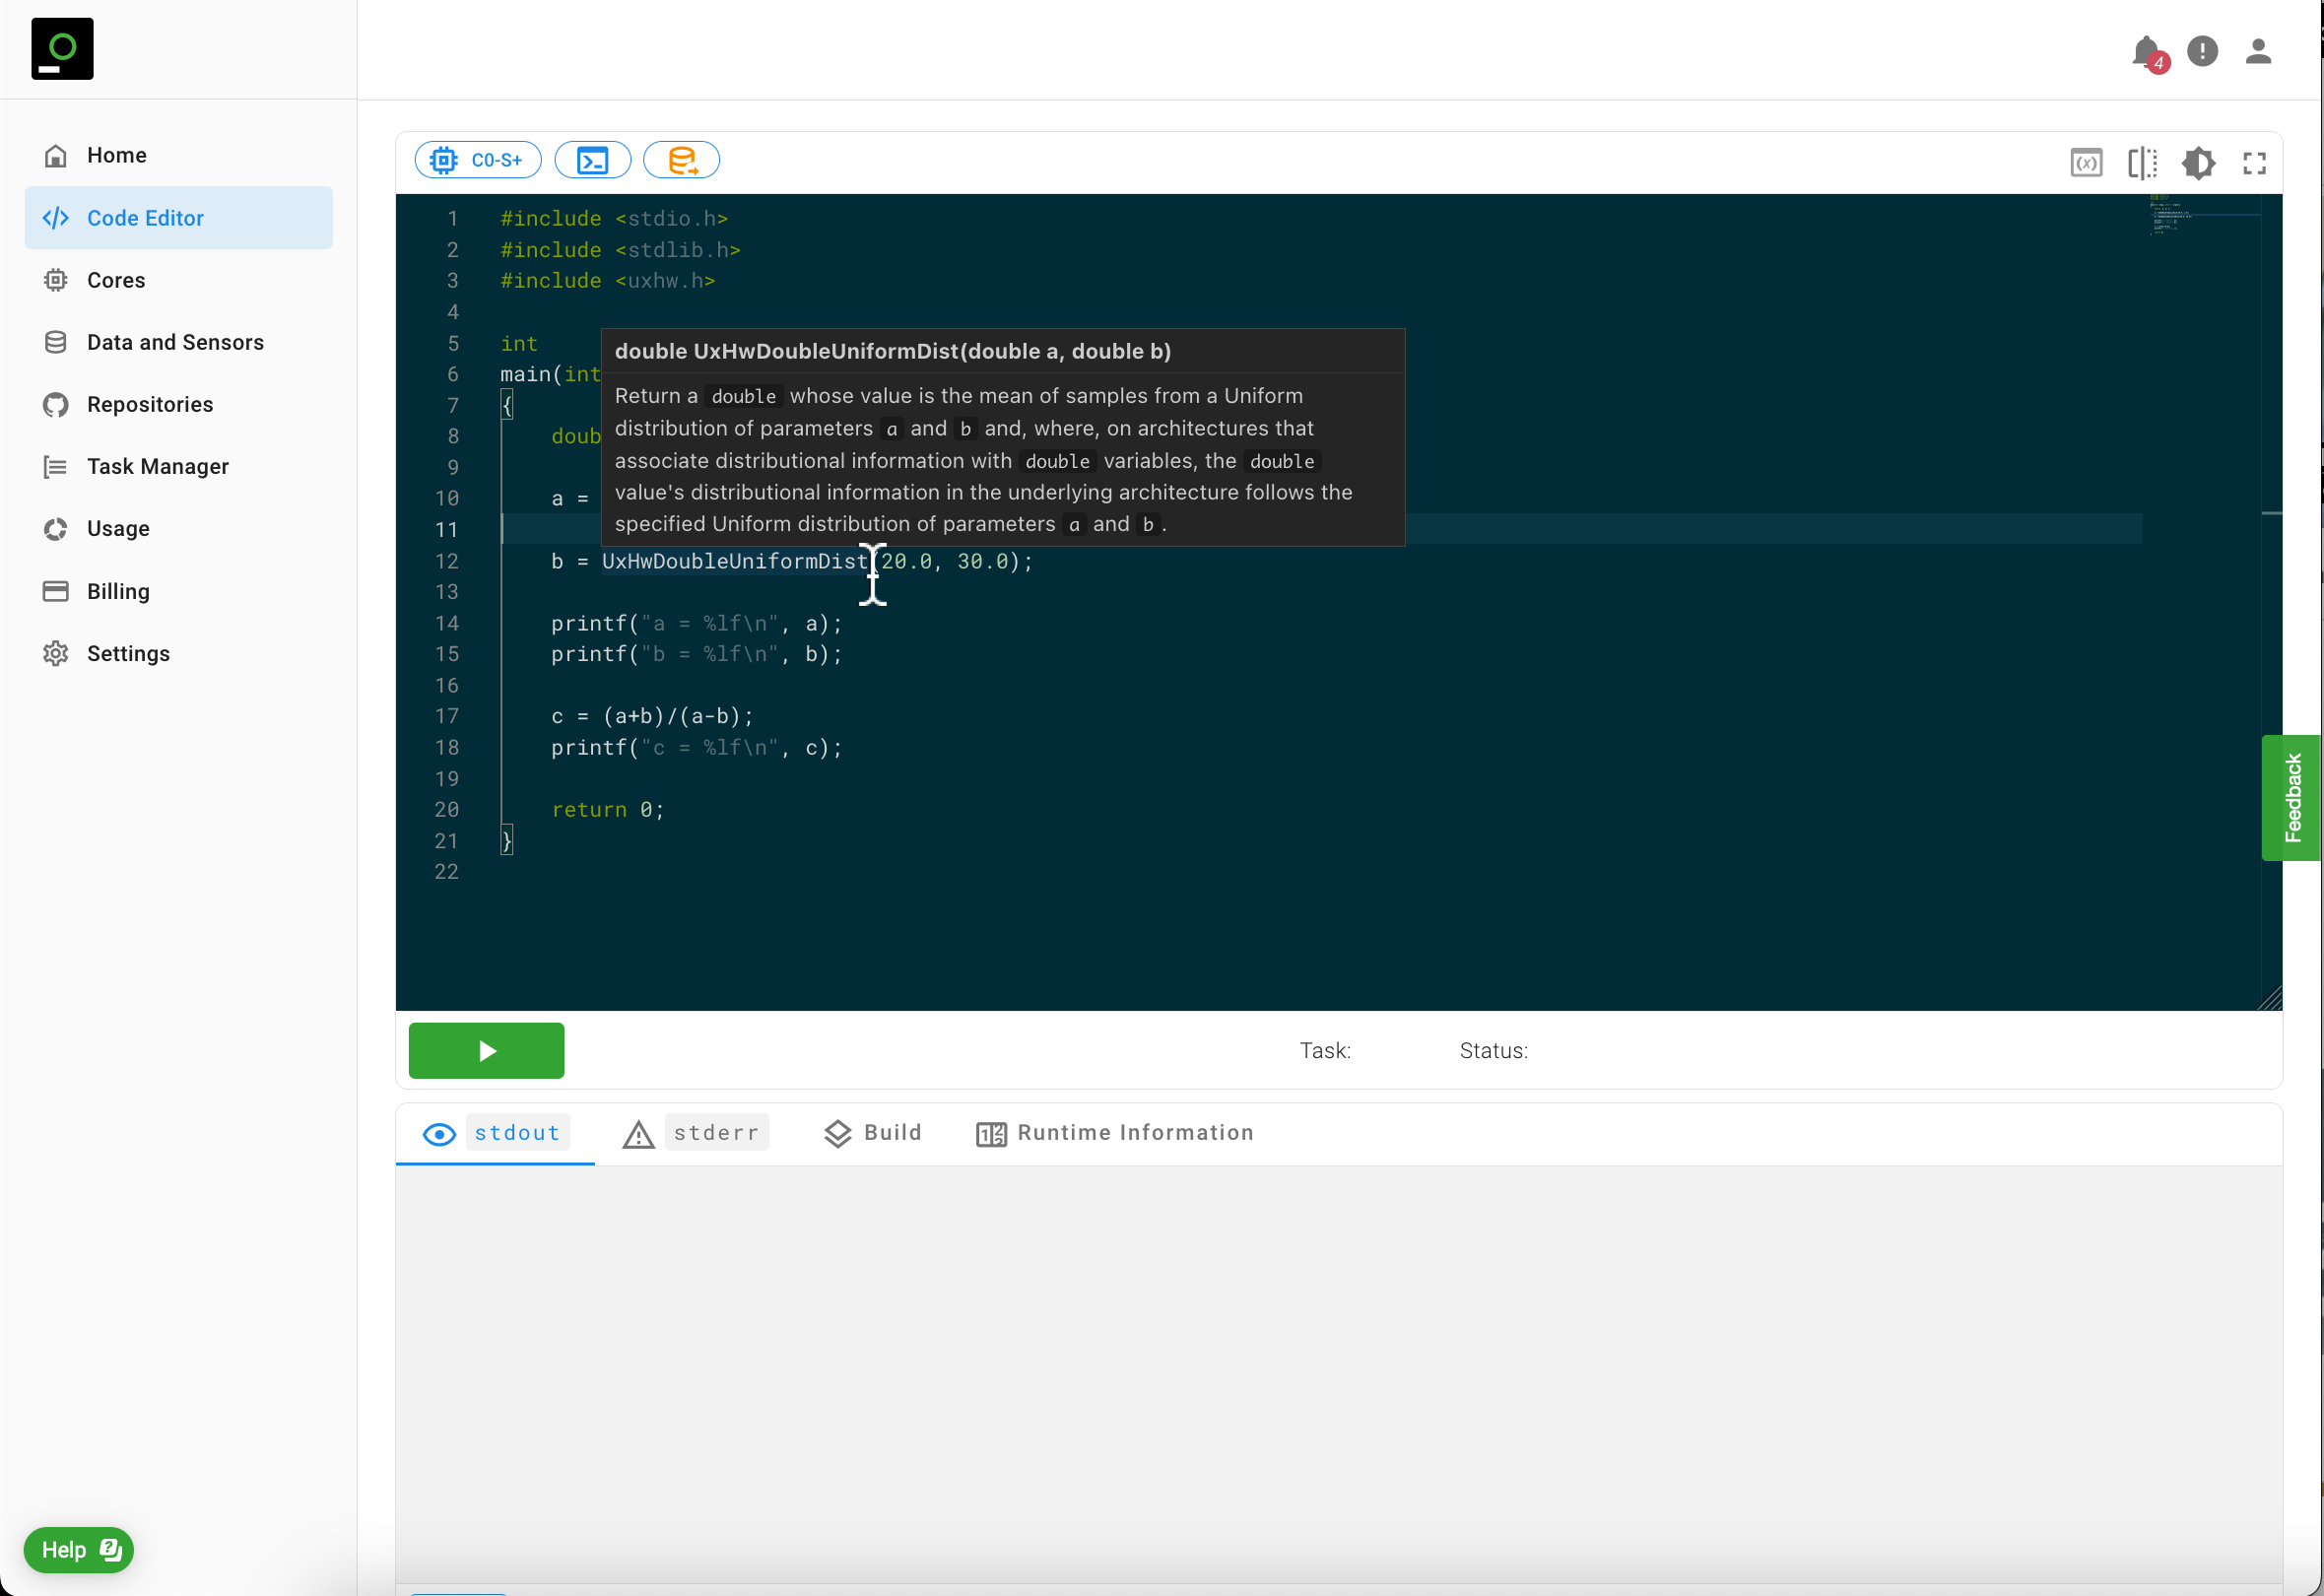
If you choose to modify your applications to take advantage of and act on the uncertainty information that the Signaloid Cloud Compute Engine automatically tracks, you can optionally use the Signaloid Ux Hardware API to ingest and inspect distributional uncertainty information. The Code Editor automatically recognizes uses of the Signaloid UxHw API functions and provides built-in autocompletion and contextual help. Figure 10 shows how the Code Editor will show you the definition and a brief explanation of a Signaloid UxHw API function when you hover your mouse over it.
Task Status Panel
Every program execution on the Signaloid Cloud Developer Platform is called a Task and the Compute Engine assigns it a Task ID: a unique string that globally identifies the Task. Click the "Compile and Run" button () button to build and run the source code in the Code Editor. The Editor displays the Task ID and the Task status in the same panel as the "Compile and Run" button. You can copy the Task ID using the "Copy Task ID to clipboard" button ().
The Task status transitions through the states Accepted, Initialising, In Progress, and Completed.
If there are compilation errors when building your application, the Signaloid Cloud Developer Platform will set the Task status to Stopped and surface
the compilation error at the build tab of the Results Panel.
When the Task status becomes Completed it means the Task finished execution successfully. Before that, you can cancel the execution of the Task using
the "Cancel" button. Figure 11 shows the Task status panel during the execution of a Task. Figure 12 shows the Task status panel of a completed Task.

In Progress. You can cancel execution using the "Cancel" button.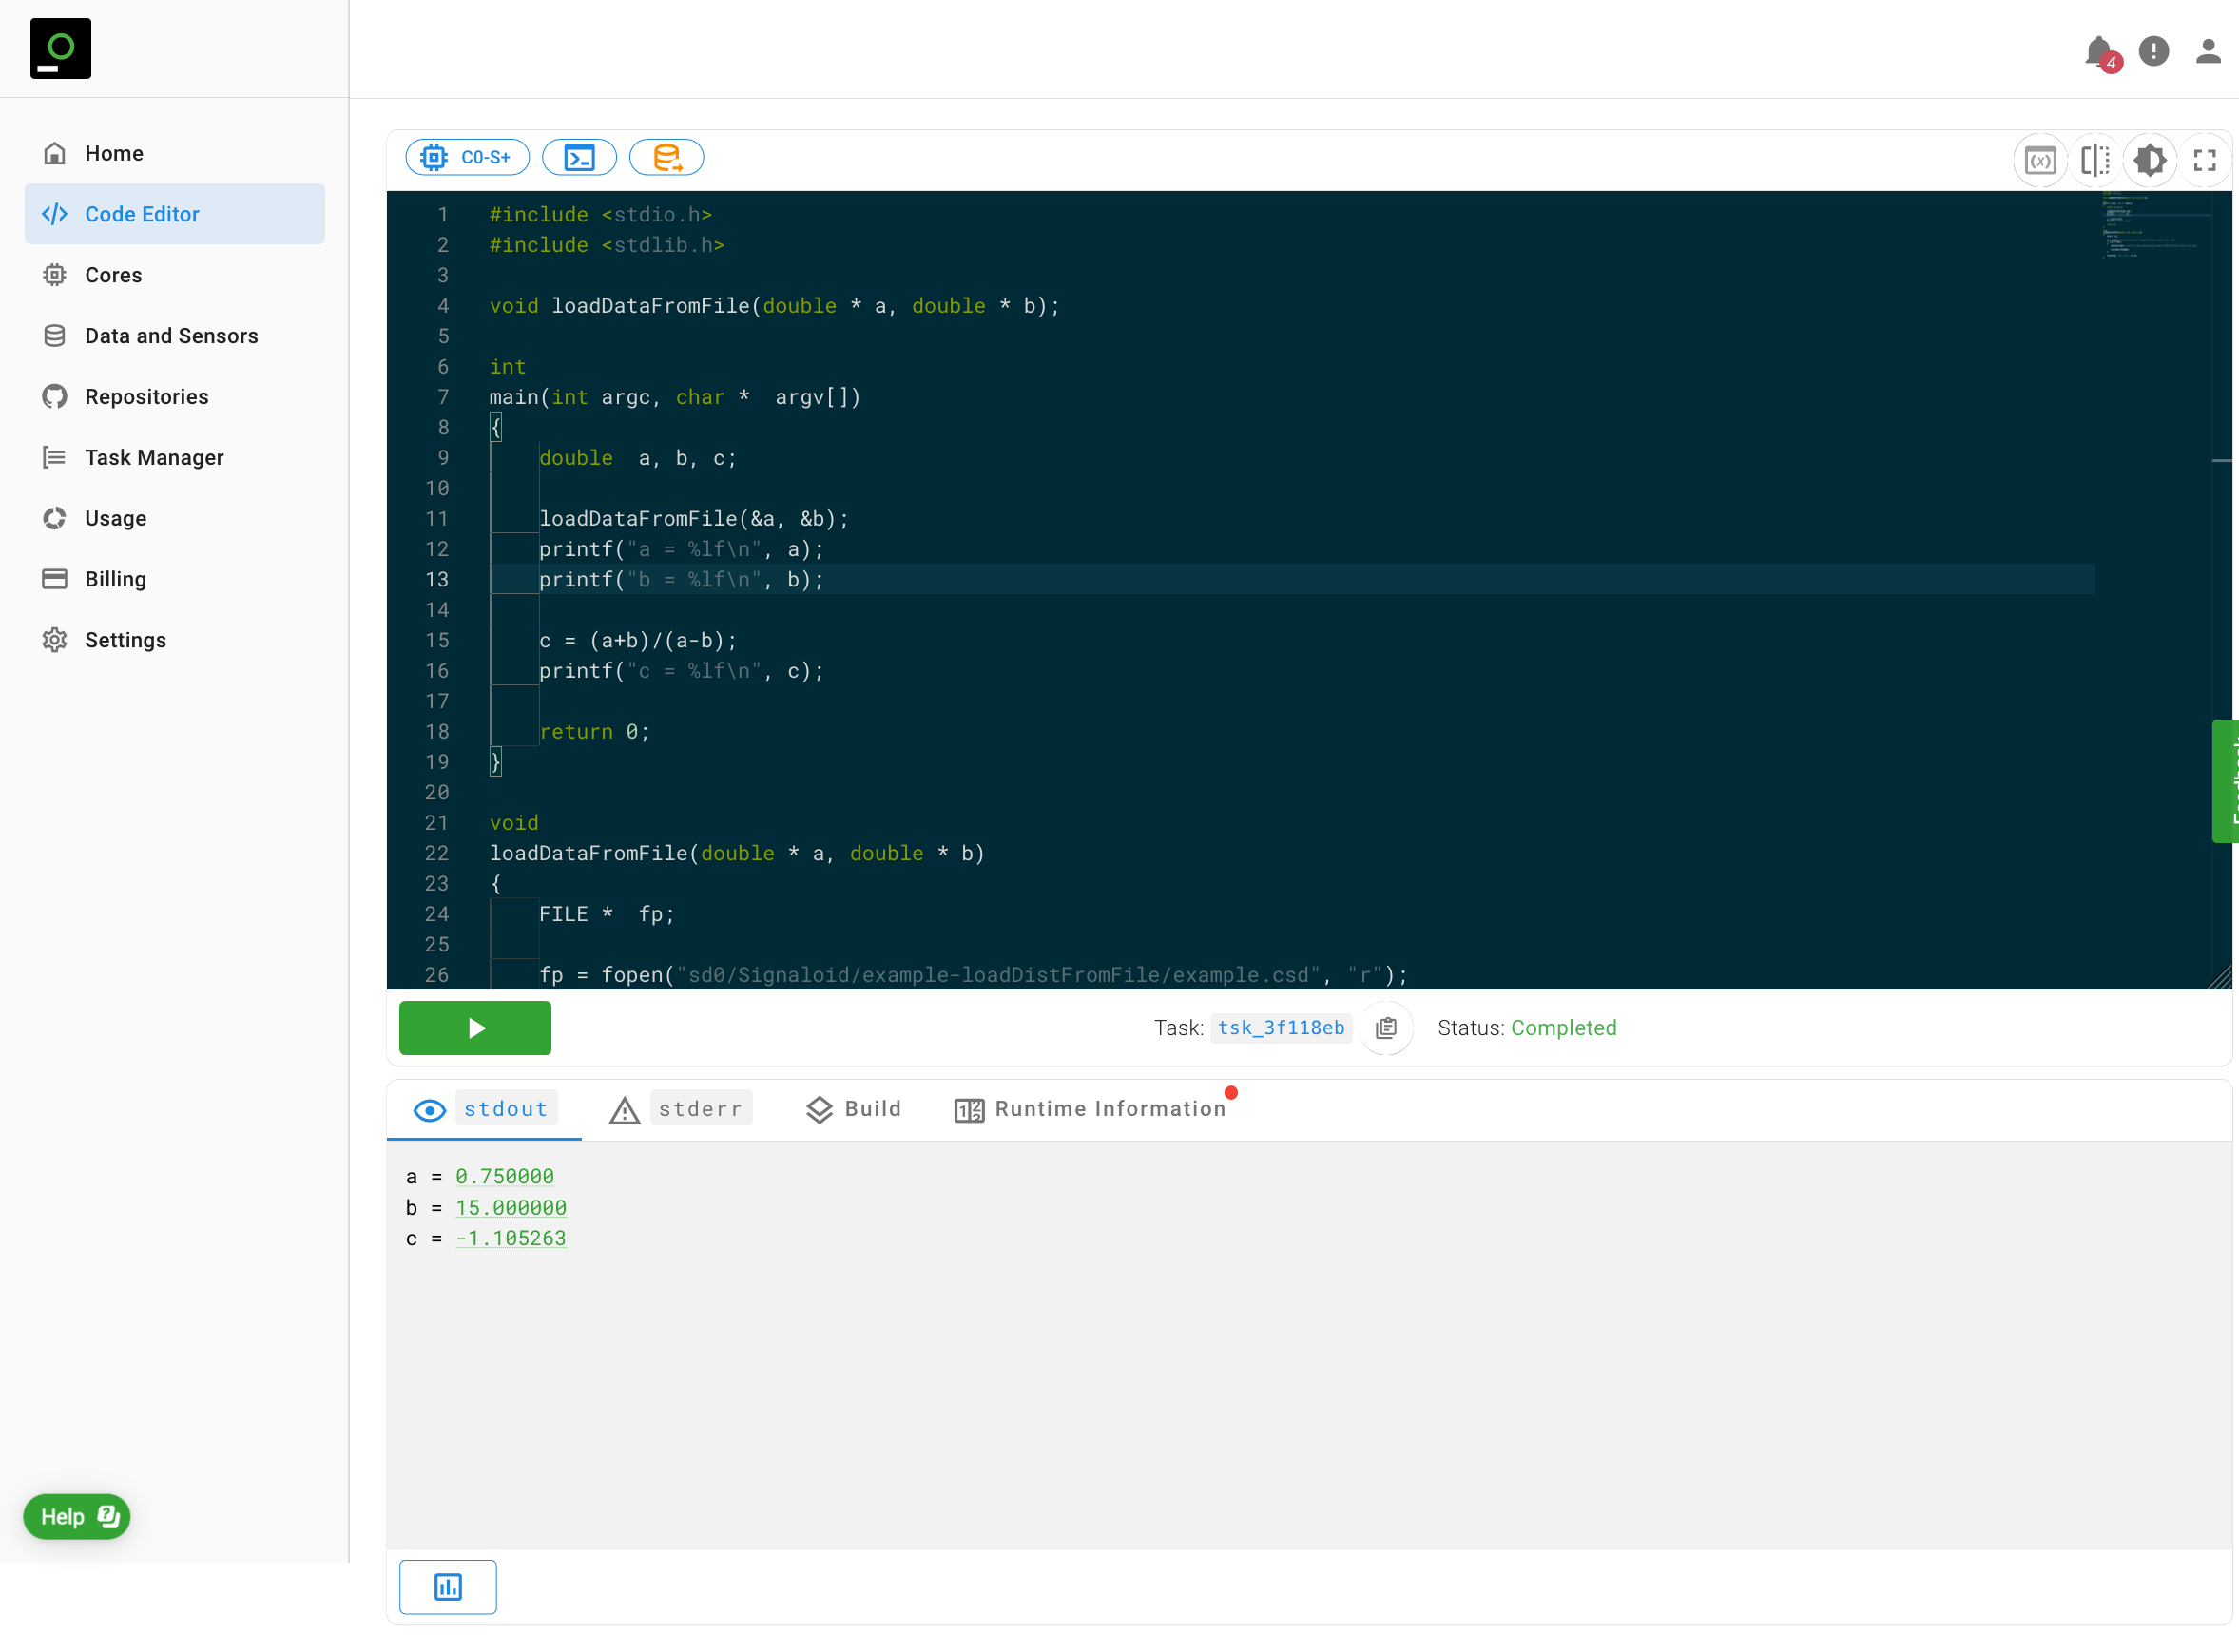
Results Panel
The Results Panel shows you the build and run output of an application execution on one of the Signaloid C0 cores. It contains:
- The
stdouttab shows the output of your application to its standard output file descriptor. Printed variables that have associated uncertainty are in underlined and in green typeface. Hovering over these values or clicking them shows a plot of the uncertainty associated with the value in the form of a histogram. - The
stderrtab shows the output of your application to its standard error file descriptor. - The build tab shows any errors and warnings from the build process of your application.
- The runtime information tab shows system information about the executed Task, such as the actual amount of execution time on the C0 processor and the total dynamic instruction credits the Task consumed.
Figure 13 shows the output of the default source code example of the Signaloid Cloud Developer Platform. After you hover your mouse over a highlighted, printed value you can see a plot of its associated distributional information.
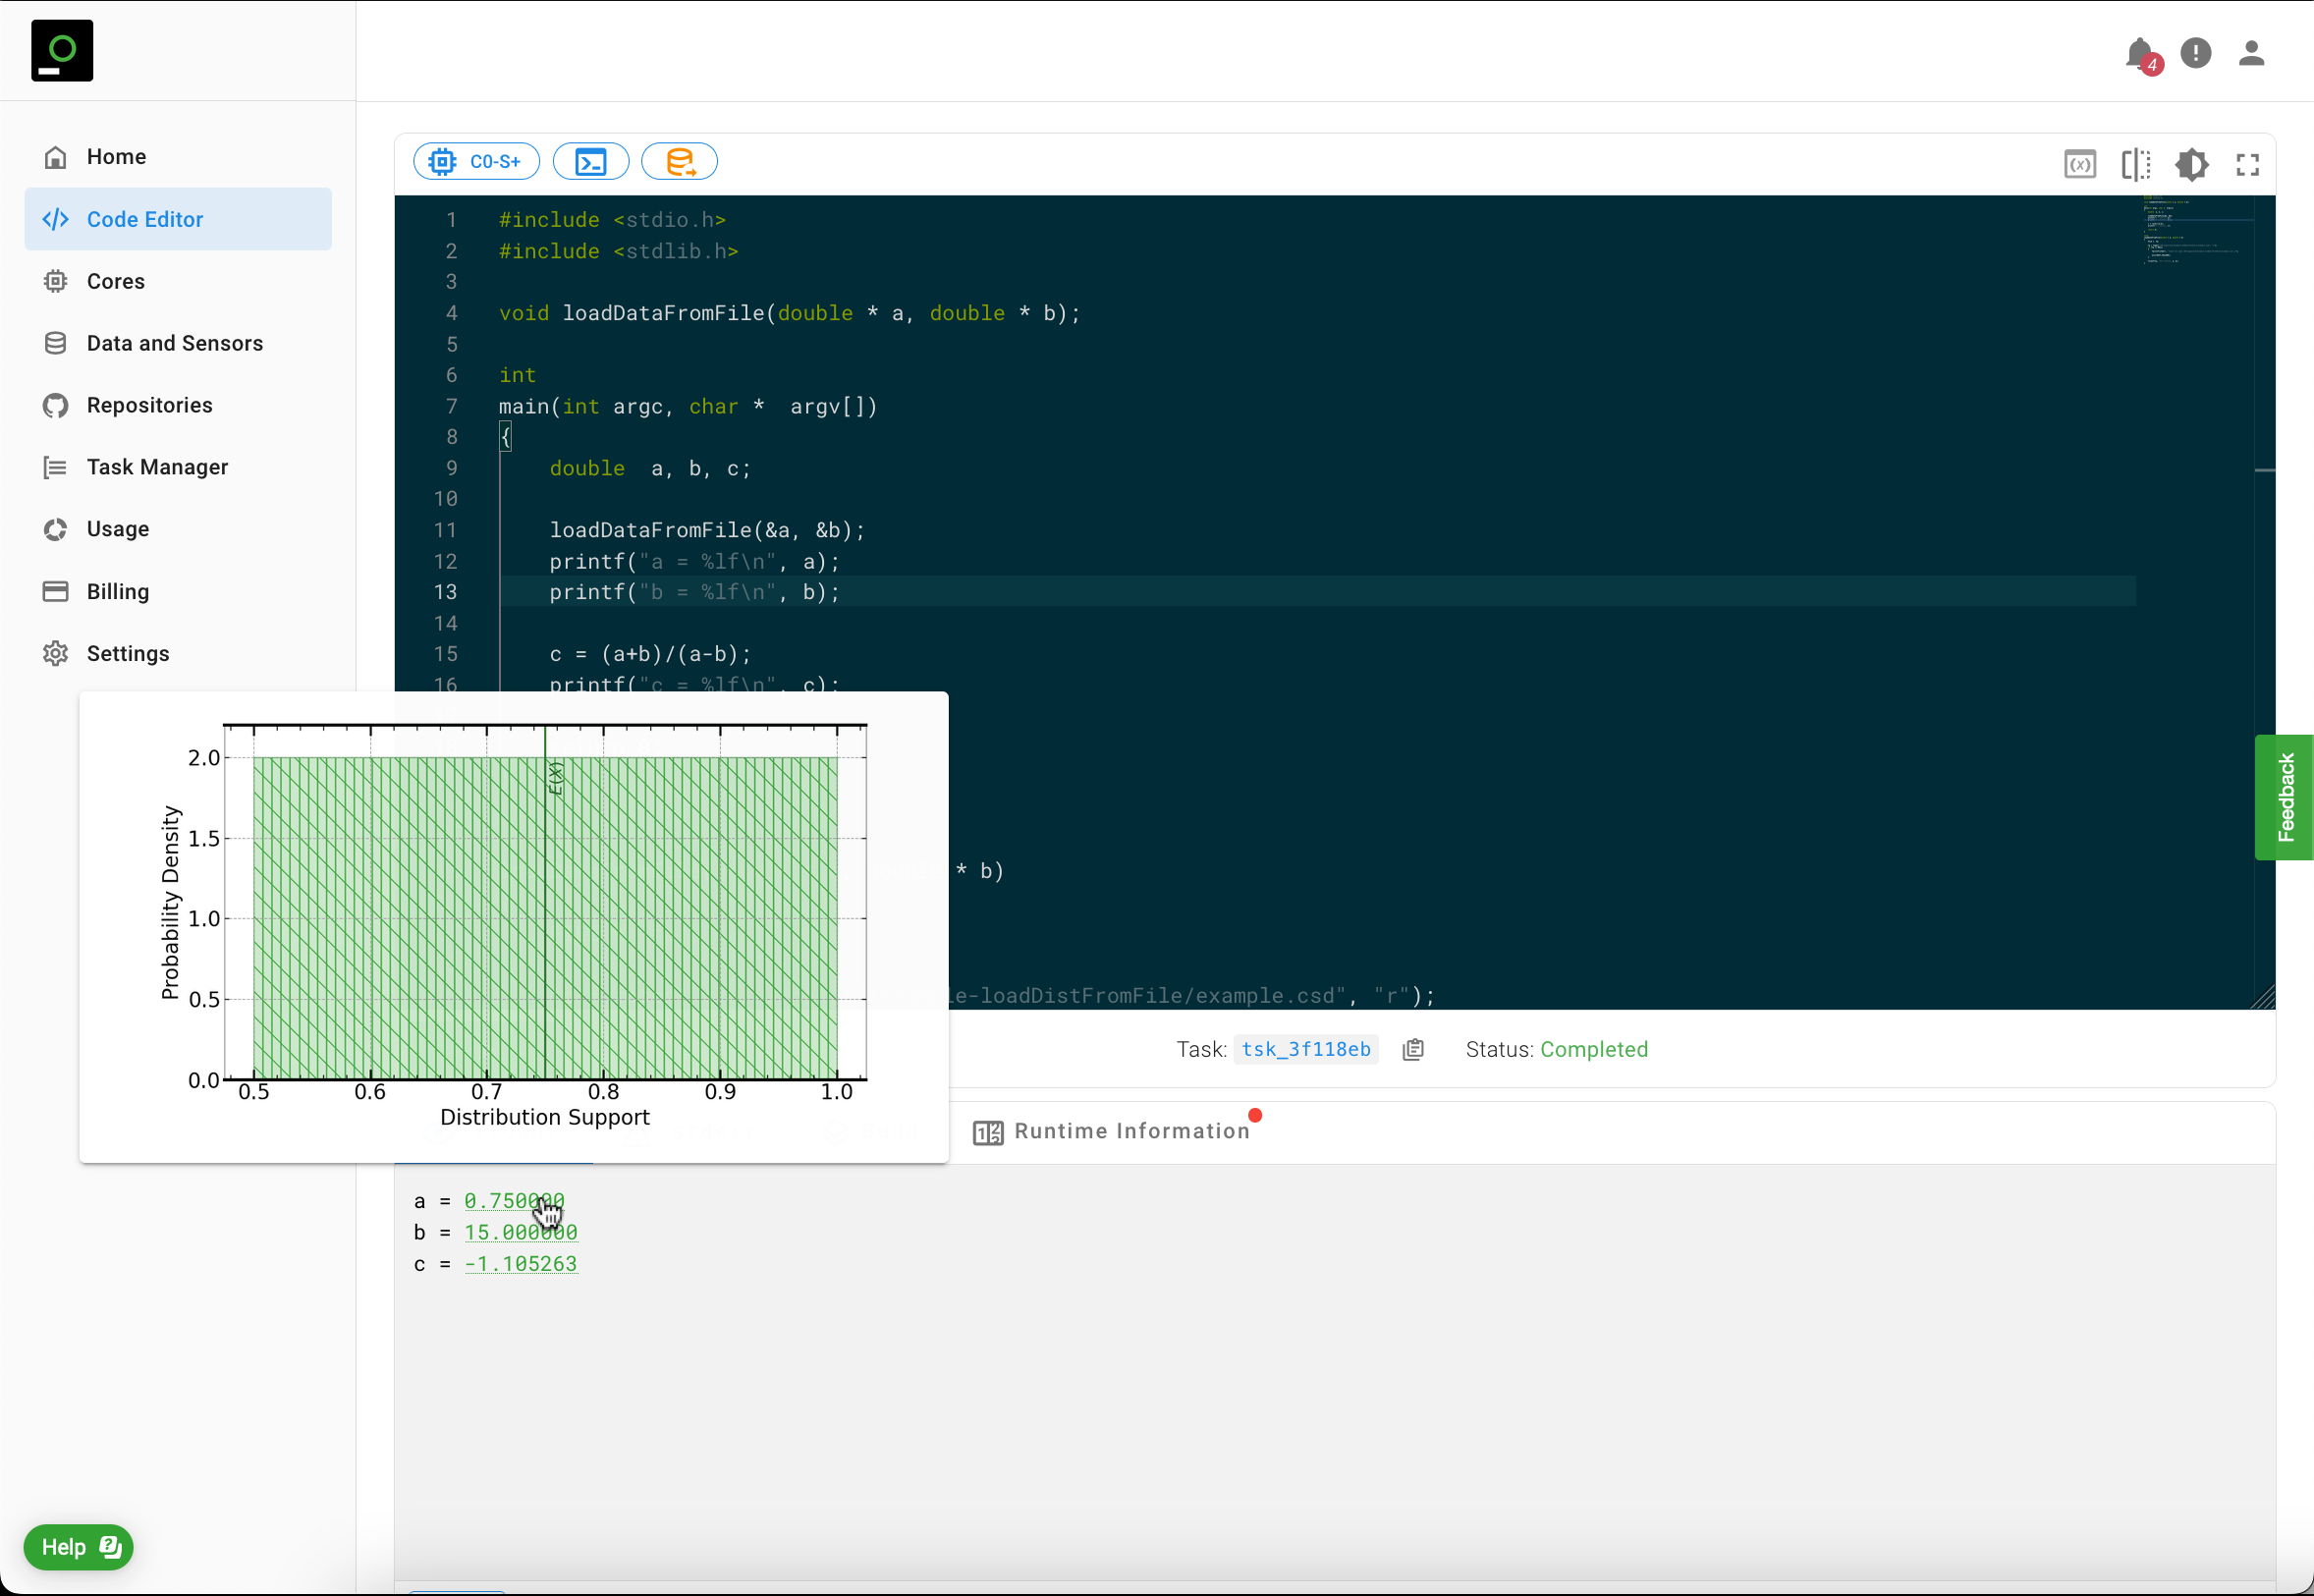
stdout tab of the Results Panel shows a pop-up plot of the full uncertainty distribution associated with the highlighted printed value.You can toggle the Automatically Show Plots button ()
at the lower left of the stdout tab to instruct the Signaloid Cloud Developer Platform to show the distributional
plots automatically, without the need for hovering with your mouse over them. Figure 14 shows this option applied on the default
source code example of the Signaloid Cloud Developer Platform.
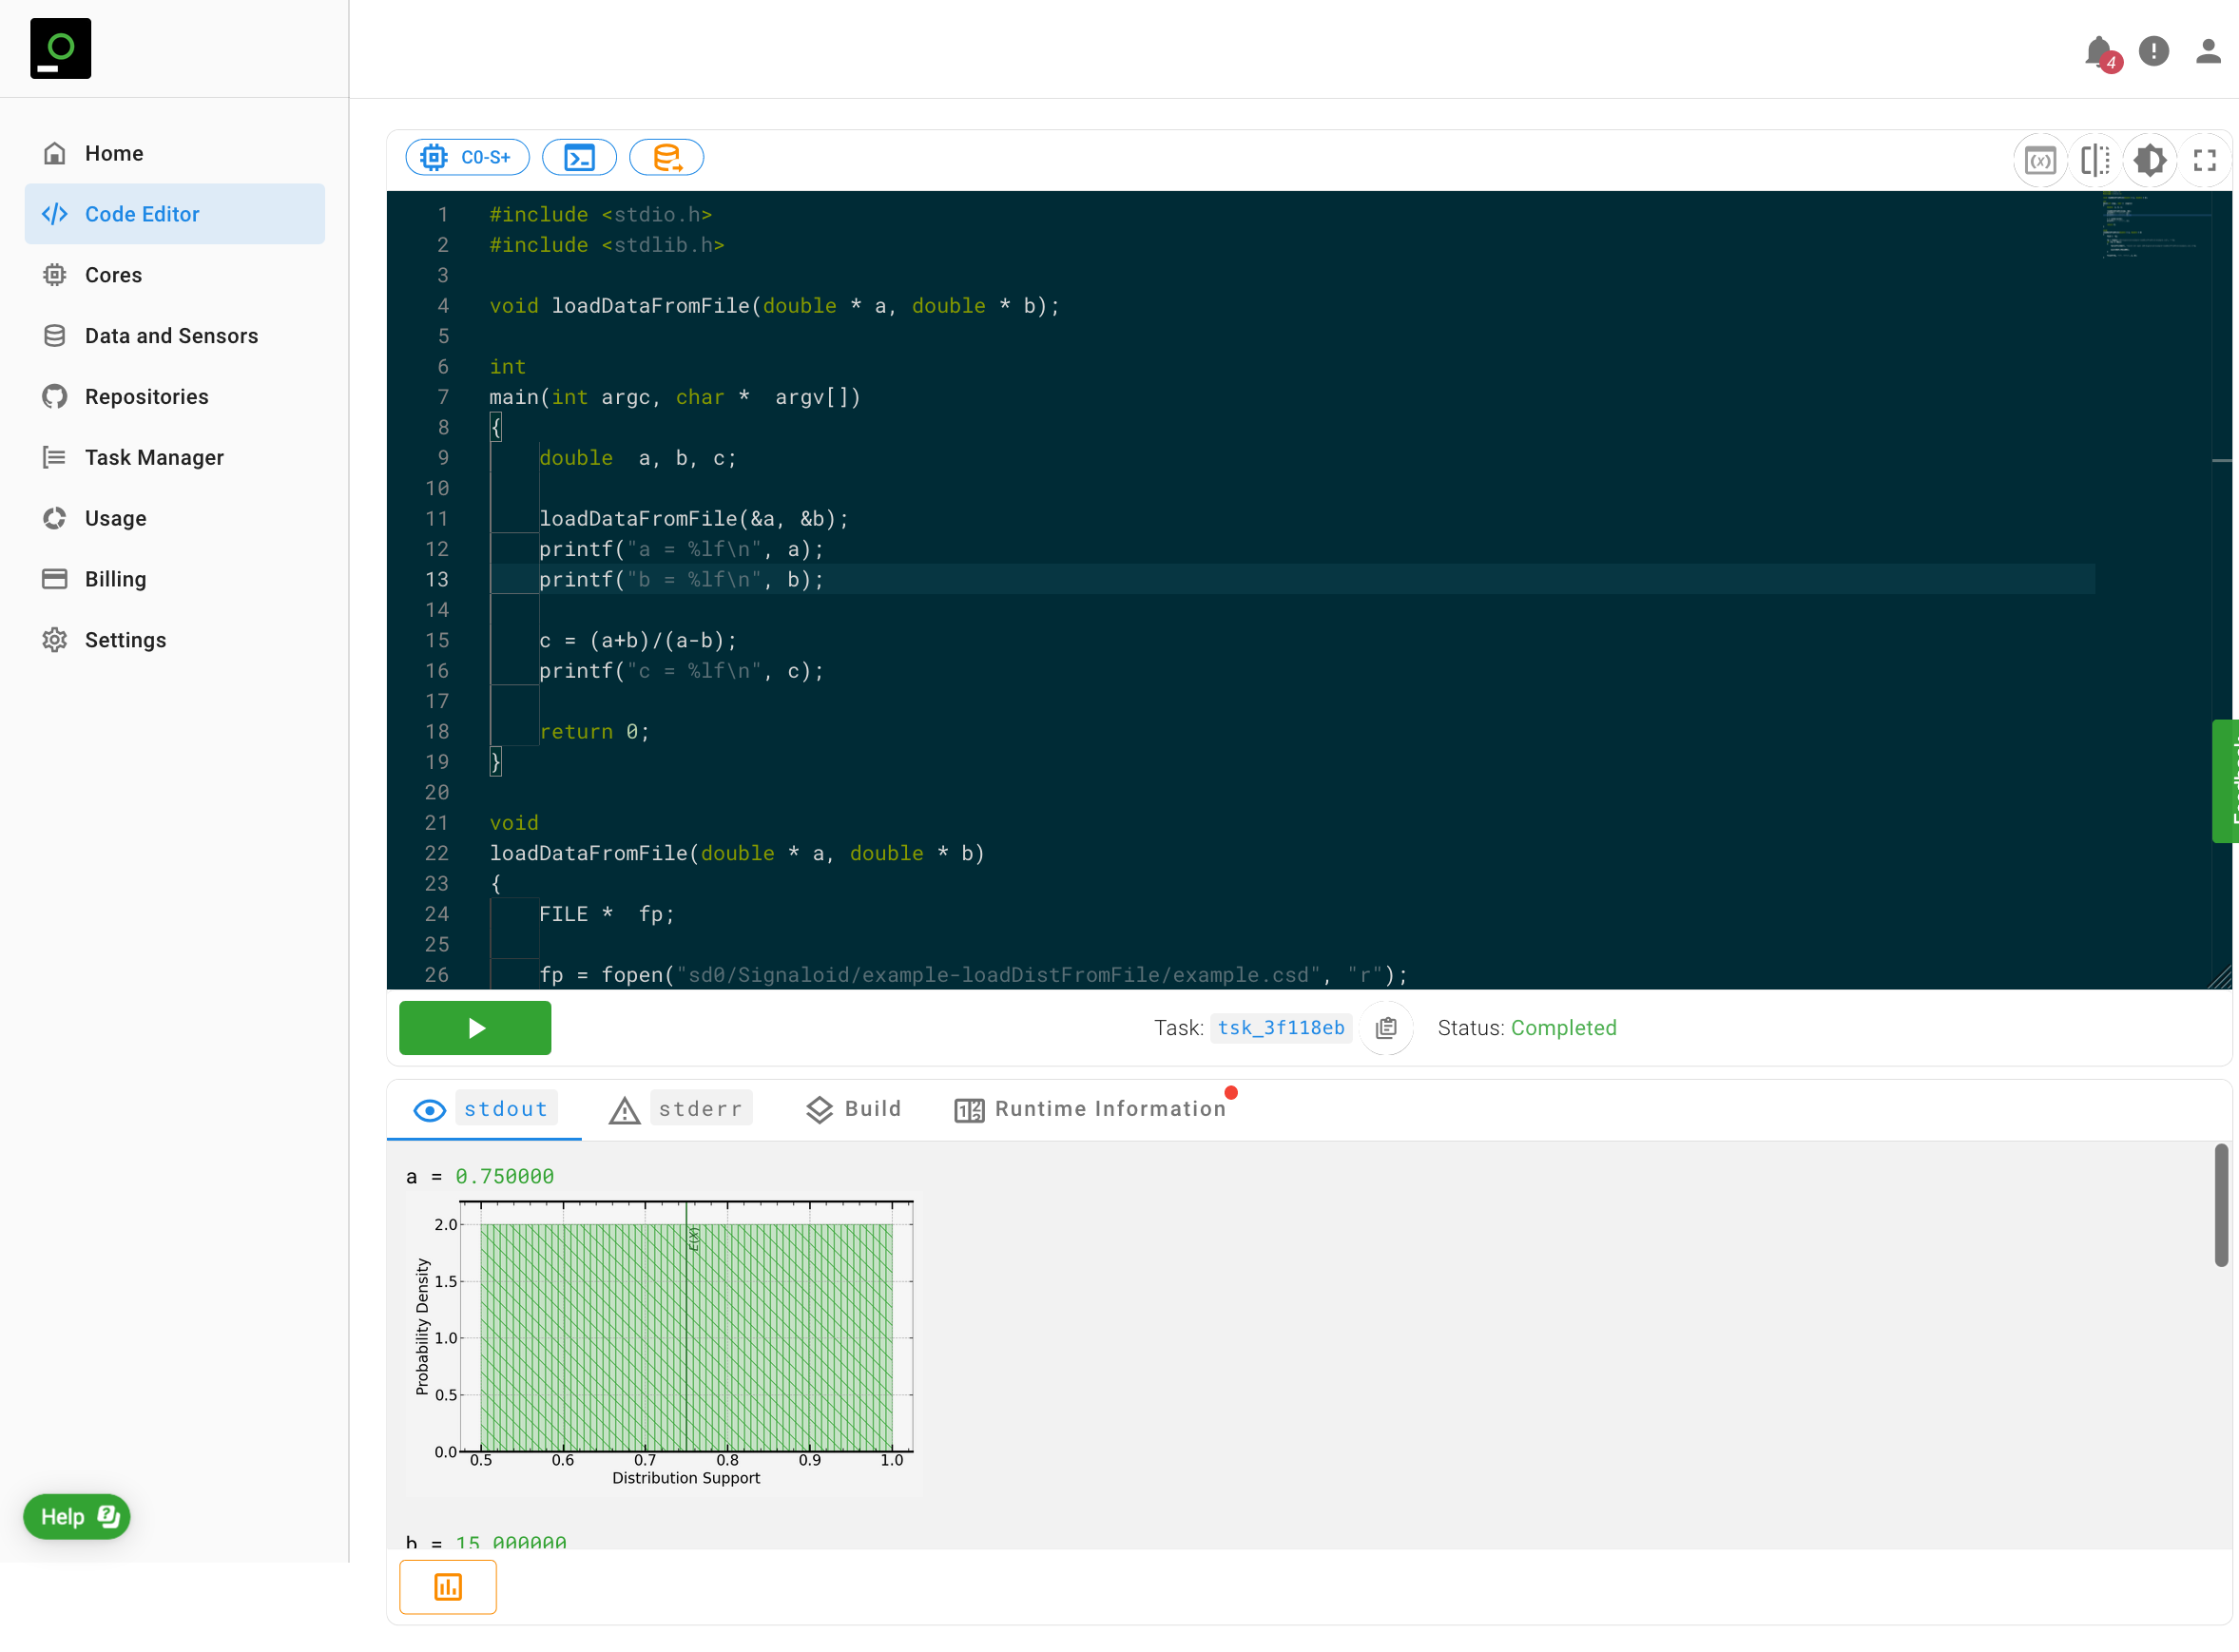
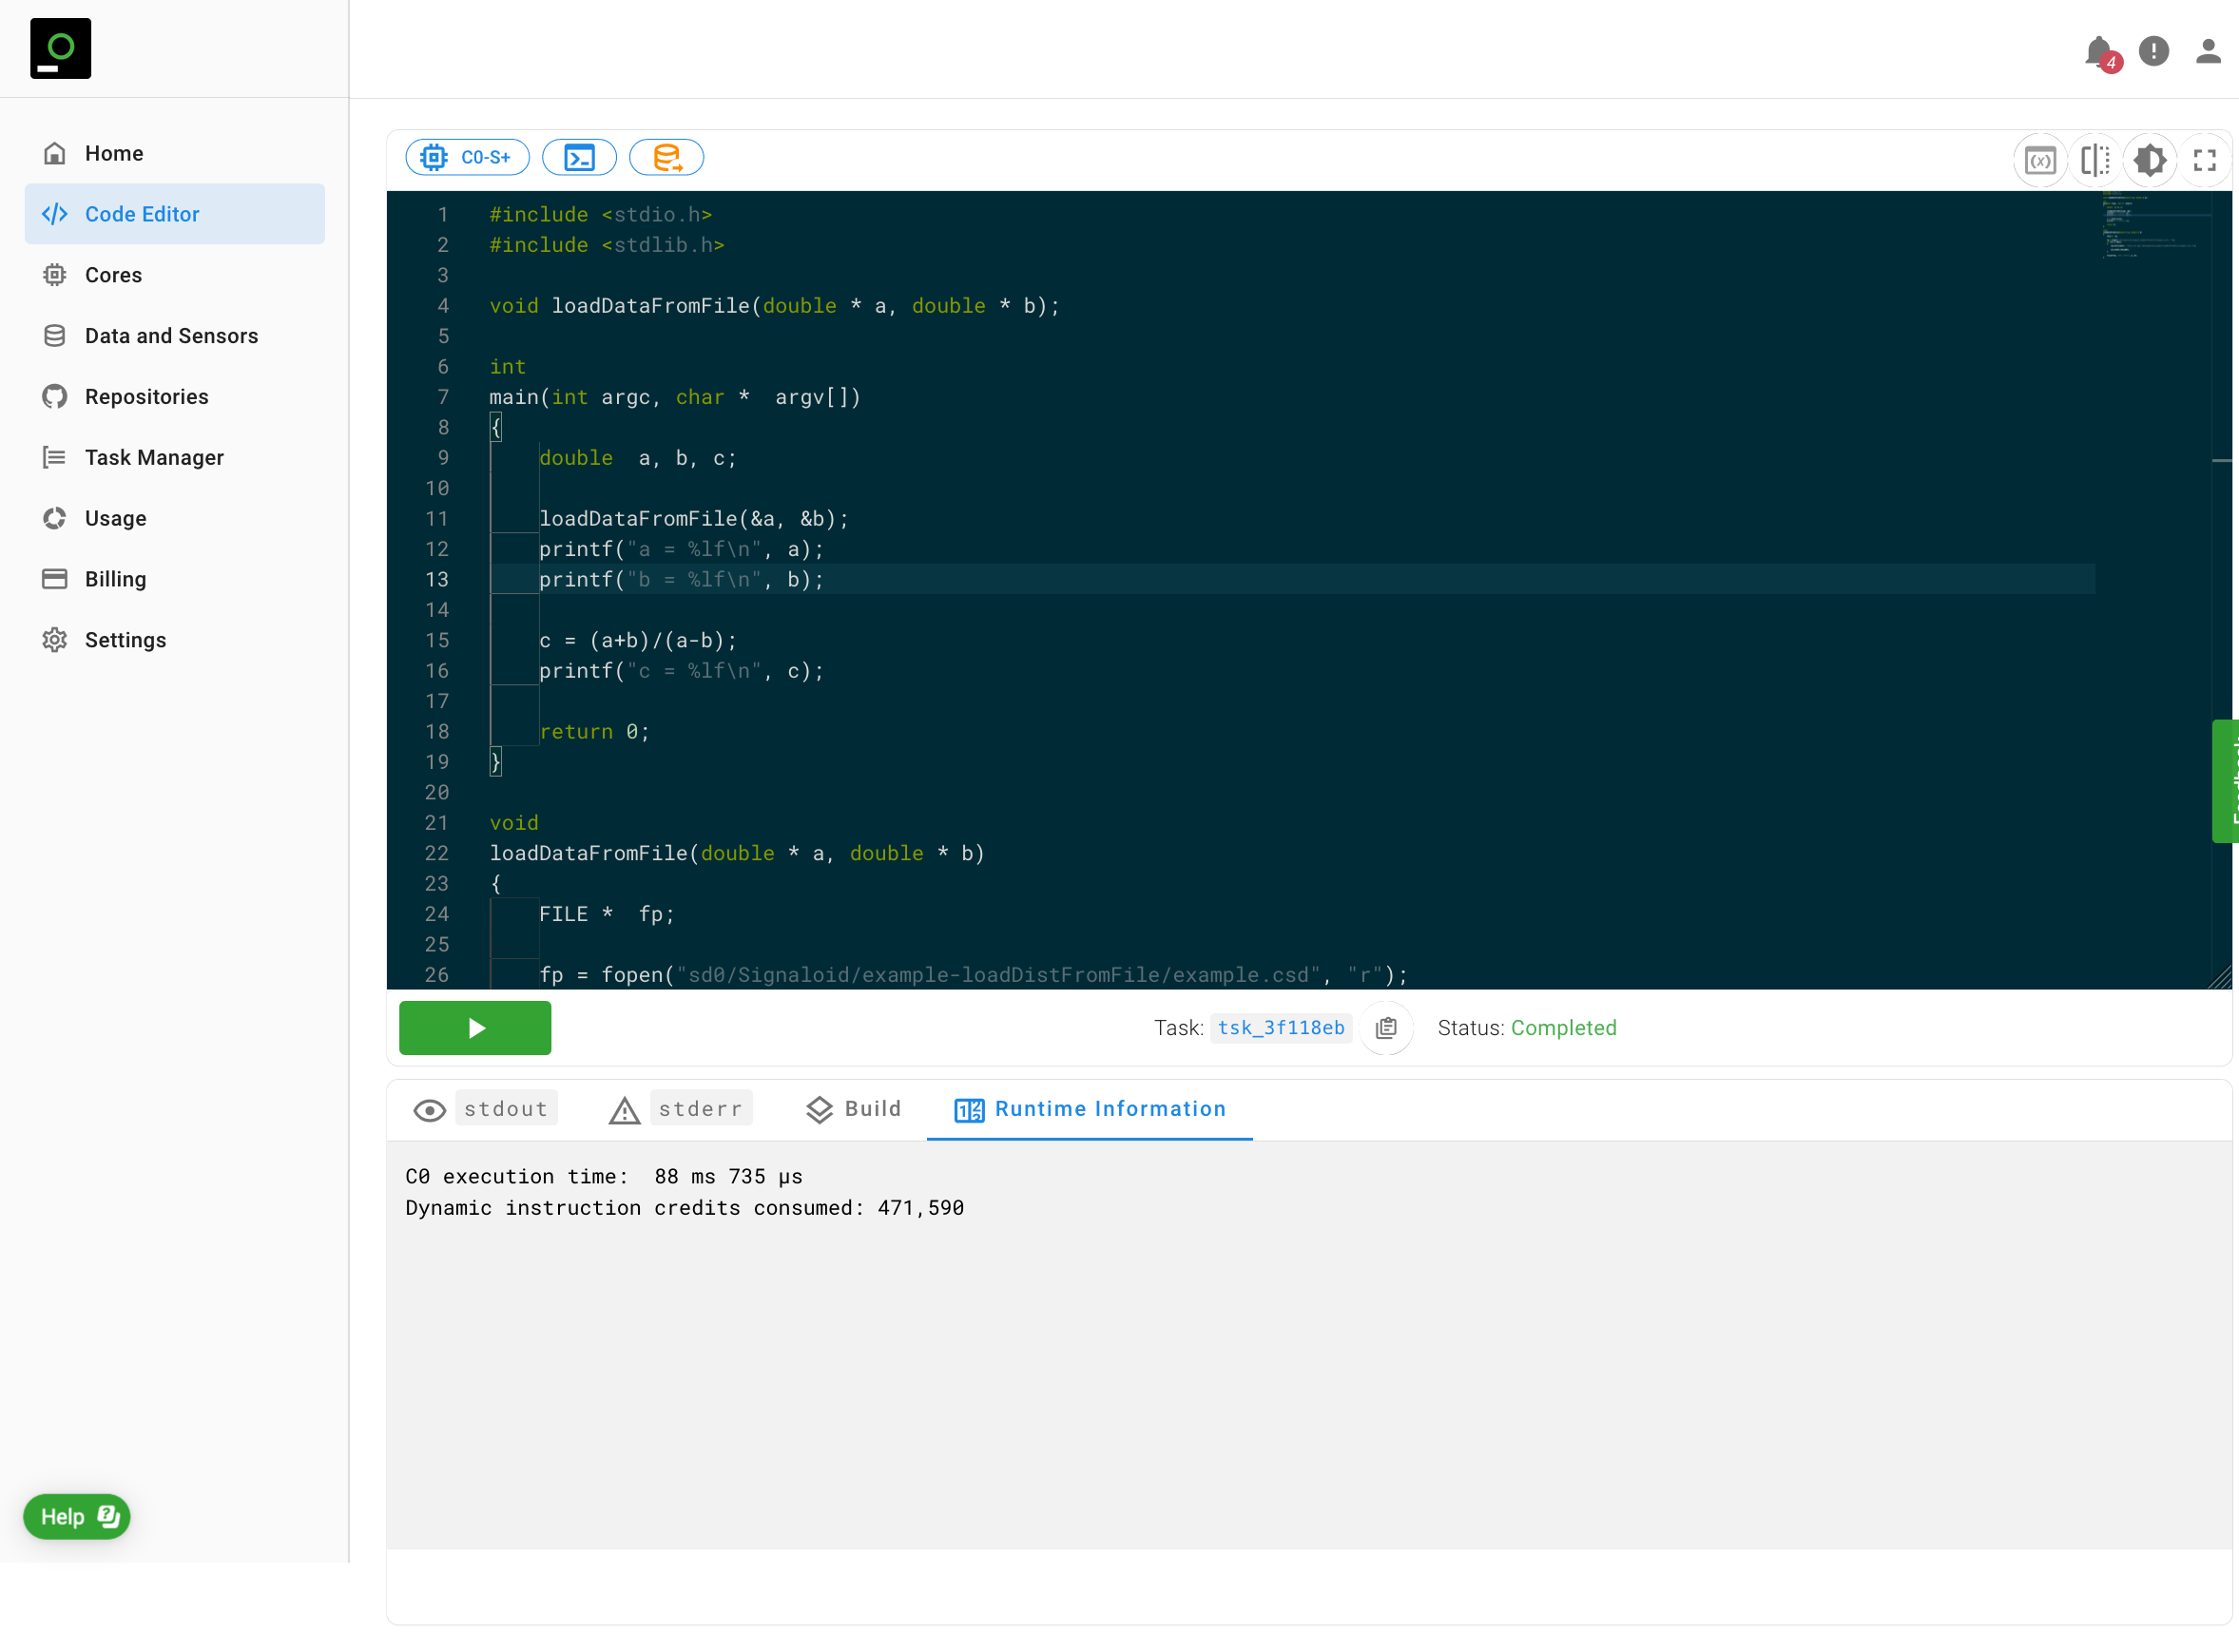
Figure 15 shows the "Runtime Information" for the default source code example executed on the Signaloid C0-S+ core. The Figure shows that the required time for the completion of the application on the Signaloid C0-S+ core was 88 milliseconds and 735 microseconds. The Signaloid C0-S+ core required 471,590 instructions to complete the execution of the application.
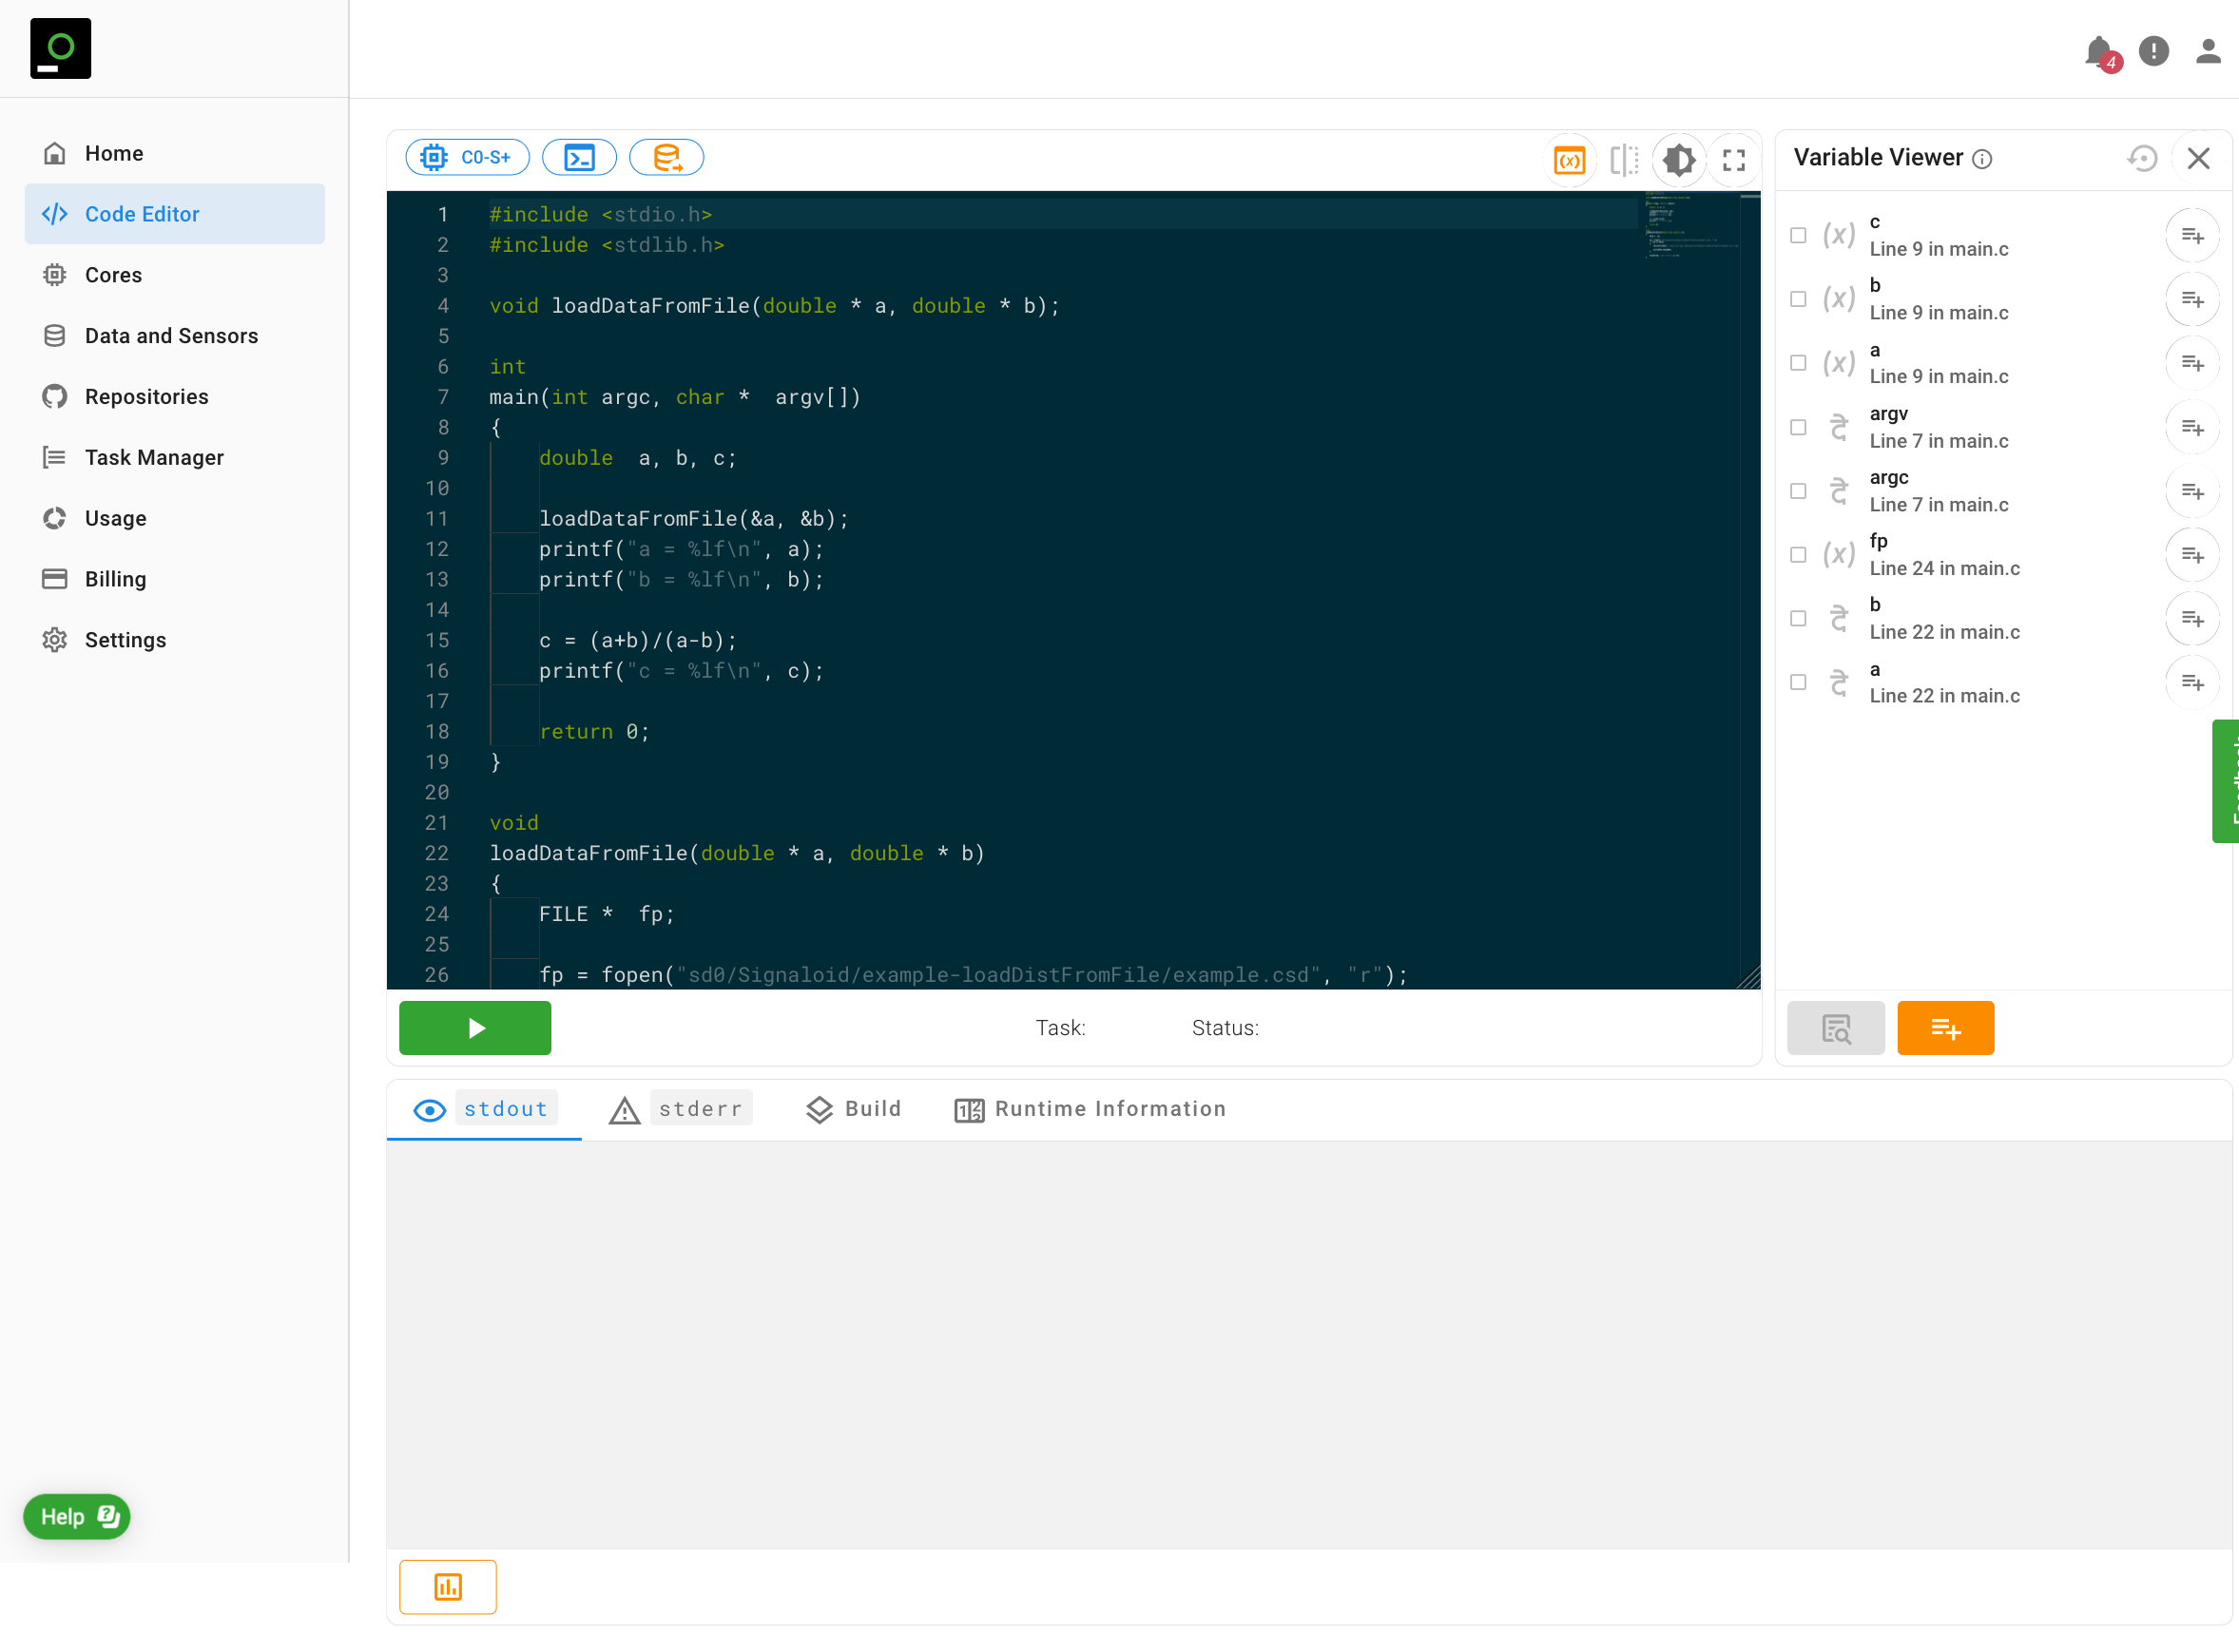
Variable Viewer
To show distributional output at the end of an application executed on a C0 Reference core, you need to instruct the Signaloid Cloud Developer Platform about which variables of your source code you want to trace. Using the Variable Viewer you can see all the variables defined in your source code. To enable the Variable viewer you need to click on the "Toggle Variable Viewer" button. Figure 16 shows the Variable viewer in your Code Editor. You can instruct the Signaloid Cloud Developer Platform to list the variables of your source code by clicking on the "Discover Variables" button.
The list of your source code variables also shows the source code file and line of the definition of each listed variable. By selecting one of these variables,
you instruct the Signaloid Cloud Developer Platform to trace it during a C0 reference core run. For more details about running applications on C0 Reference cores,
see Reference Execution. The Signaloid Cloud Developer Platform allows you to run applications
on C0 Reference cores and trace custom variables, i.e., elements of arrays and user-defined structs. For such cases, the Signaloid Cloud Developer Platform offers the
"Add Custom Variable Trace" button which allows you to explicitly specify the element that you wish to trace,
e.g., array[1] or foo.bar. You can read Reference Execution for more information about tracing variables in C0 Reference core runs.