Reference Execution
Learn how to run applications on Signaloid's C0 Reference cores
The Signaloid C0 Reference microarchitecture allows you to track uncertainty in your applications with results guaranteed to be on-par with performing a brute-force Monte Carlo simulation. This core type does not provide the significant speedups of the other core types but still gives you uncertainty tracking without requiring you to construct your own Monte Carlo evaluations (random number generation, evaluation, post-processing) around your baseline code. Here you can find more about C0 Reference cores. The key characteristic of a C0 Reference is its Reference Quality Level, which is the number of times that Signaloid Cloud Developer Platform will re-execute your application code. The C0-Reference core is the default C0 Reference core with Reference Quality Level equal to 32.
The following will guide you on how to execute applications on C0 Reference cores as well as how to instruct the Signaloid Cloud Developer Platform about which variables of your source code you want to trace. Running your application on C0 Reference cores requires the same steps as running a source code or repository task on any other Signaloid core, e.g., C0-S, C0-S+, C0-bypass, etc. To run your source code or repository application on C0 Reference cores, you only need to select the reference core from the drop-down list of your available cores. You can pass command line arguments and mount data sources for applications running on C0 Reference in the same way that you do for applications running on any other Signaloid C0 core.
To show distributional output at the end of the application re-executions that a C0 Reference core performs, the Signaloid Cloud Developer Platform needs to accumulate the particle values of variables across the different re-executions of the application.
For this reason, you need to instruct the Signaloid Cloud Developer Platform about which variables of your source code you want to trace. The traced variables must be of double or float base type, including typedef definitions to these types.
You source code can contain multiple variables with the same name, defined in different scopes of your source code. Because of this, the Signaloid Cloud Developer Platform needs to know the file and line number of the declaration of the variable
that you wish to trace. In this way, the Signaloid Cloud Developer Platform can uniquely identify the variable that you want to trace. Using the "Variable Viewer", available both for source code and repository runs, you can see all the variables
defined in your source code.
Reference Runs in the Code Editor
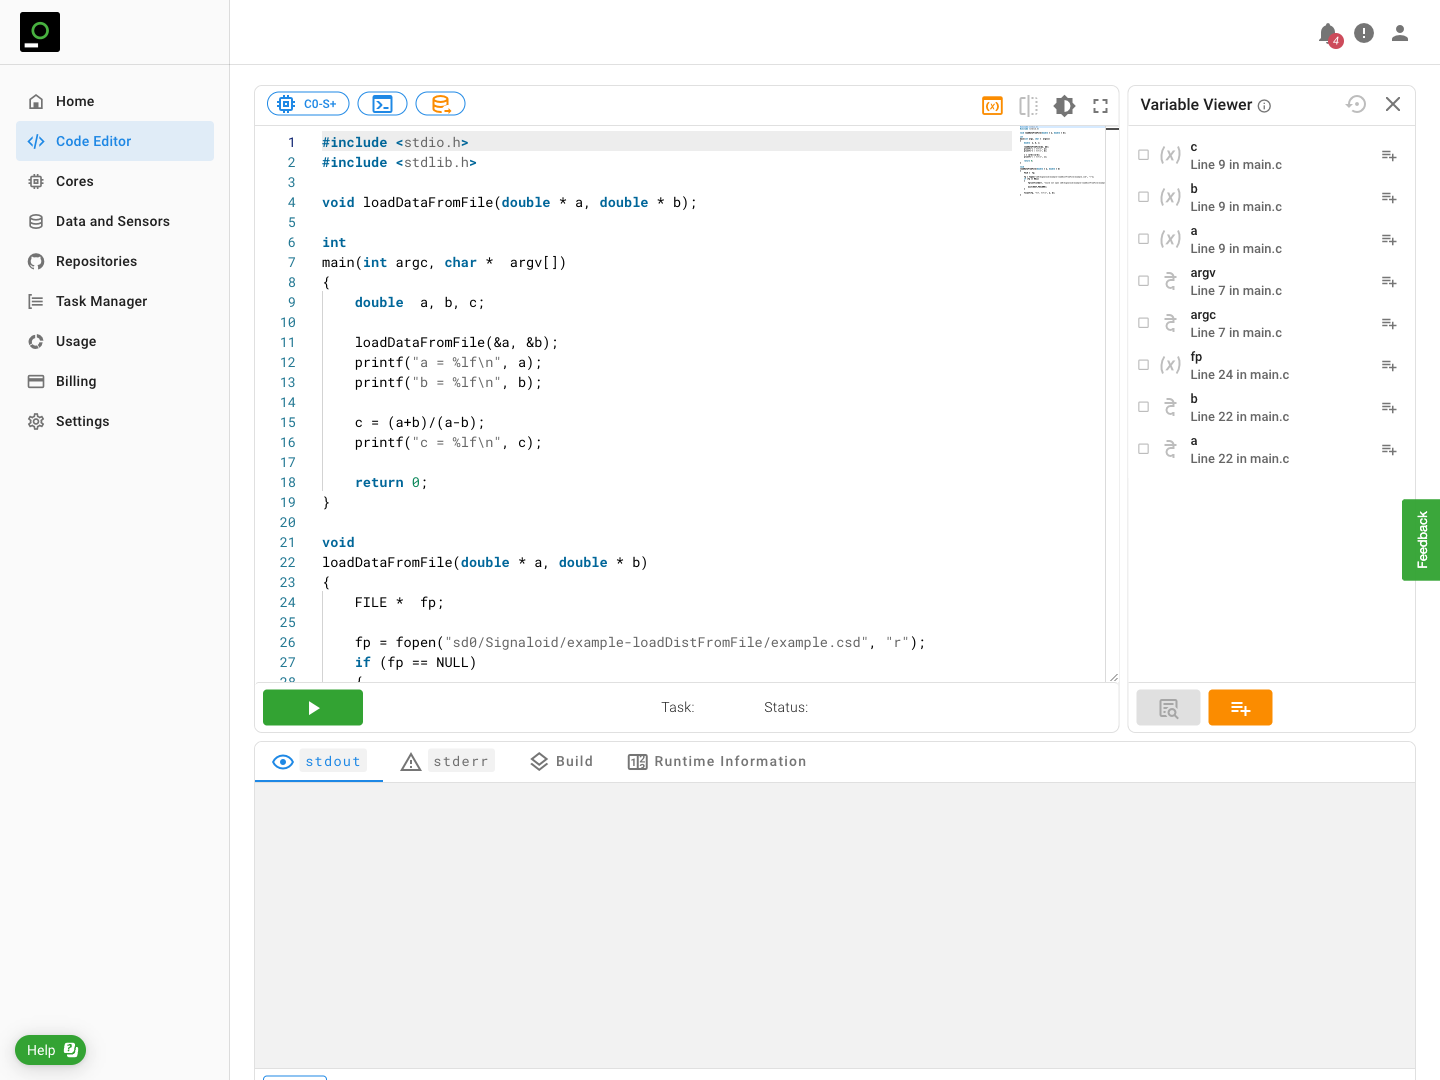
To enable the "Variable Viewer" for a code editor run you need to click on the "Toggle Variable Viewer" button. Figure 1 shows the "Variable Viewer" in a code editor run. You can instruct the Signaloid Cloud Developer Platform to list the variables of your source code by clicking on the Discover Variables button. The list of your source code variables also shows the source code file and line of the declaration of each listed variable. By selecting one of these variables, you instruct the Signaloid Cloud Developer Platform to trace it during a C0 reference core run. For the variables that you have selected, the Signaloid Cloud Developer Platform will show you a distributional output wherever you print the contents of the variable in your source code. Figure 2 shows a Code Editor completed run using the default C0-reference core.
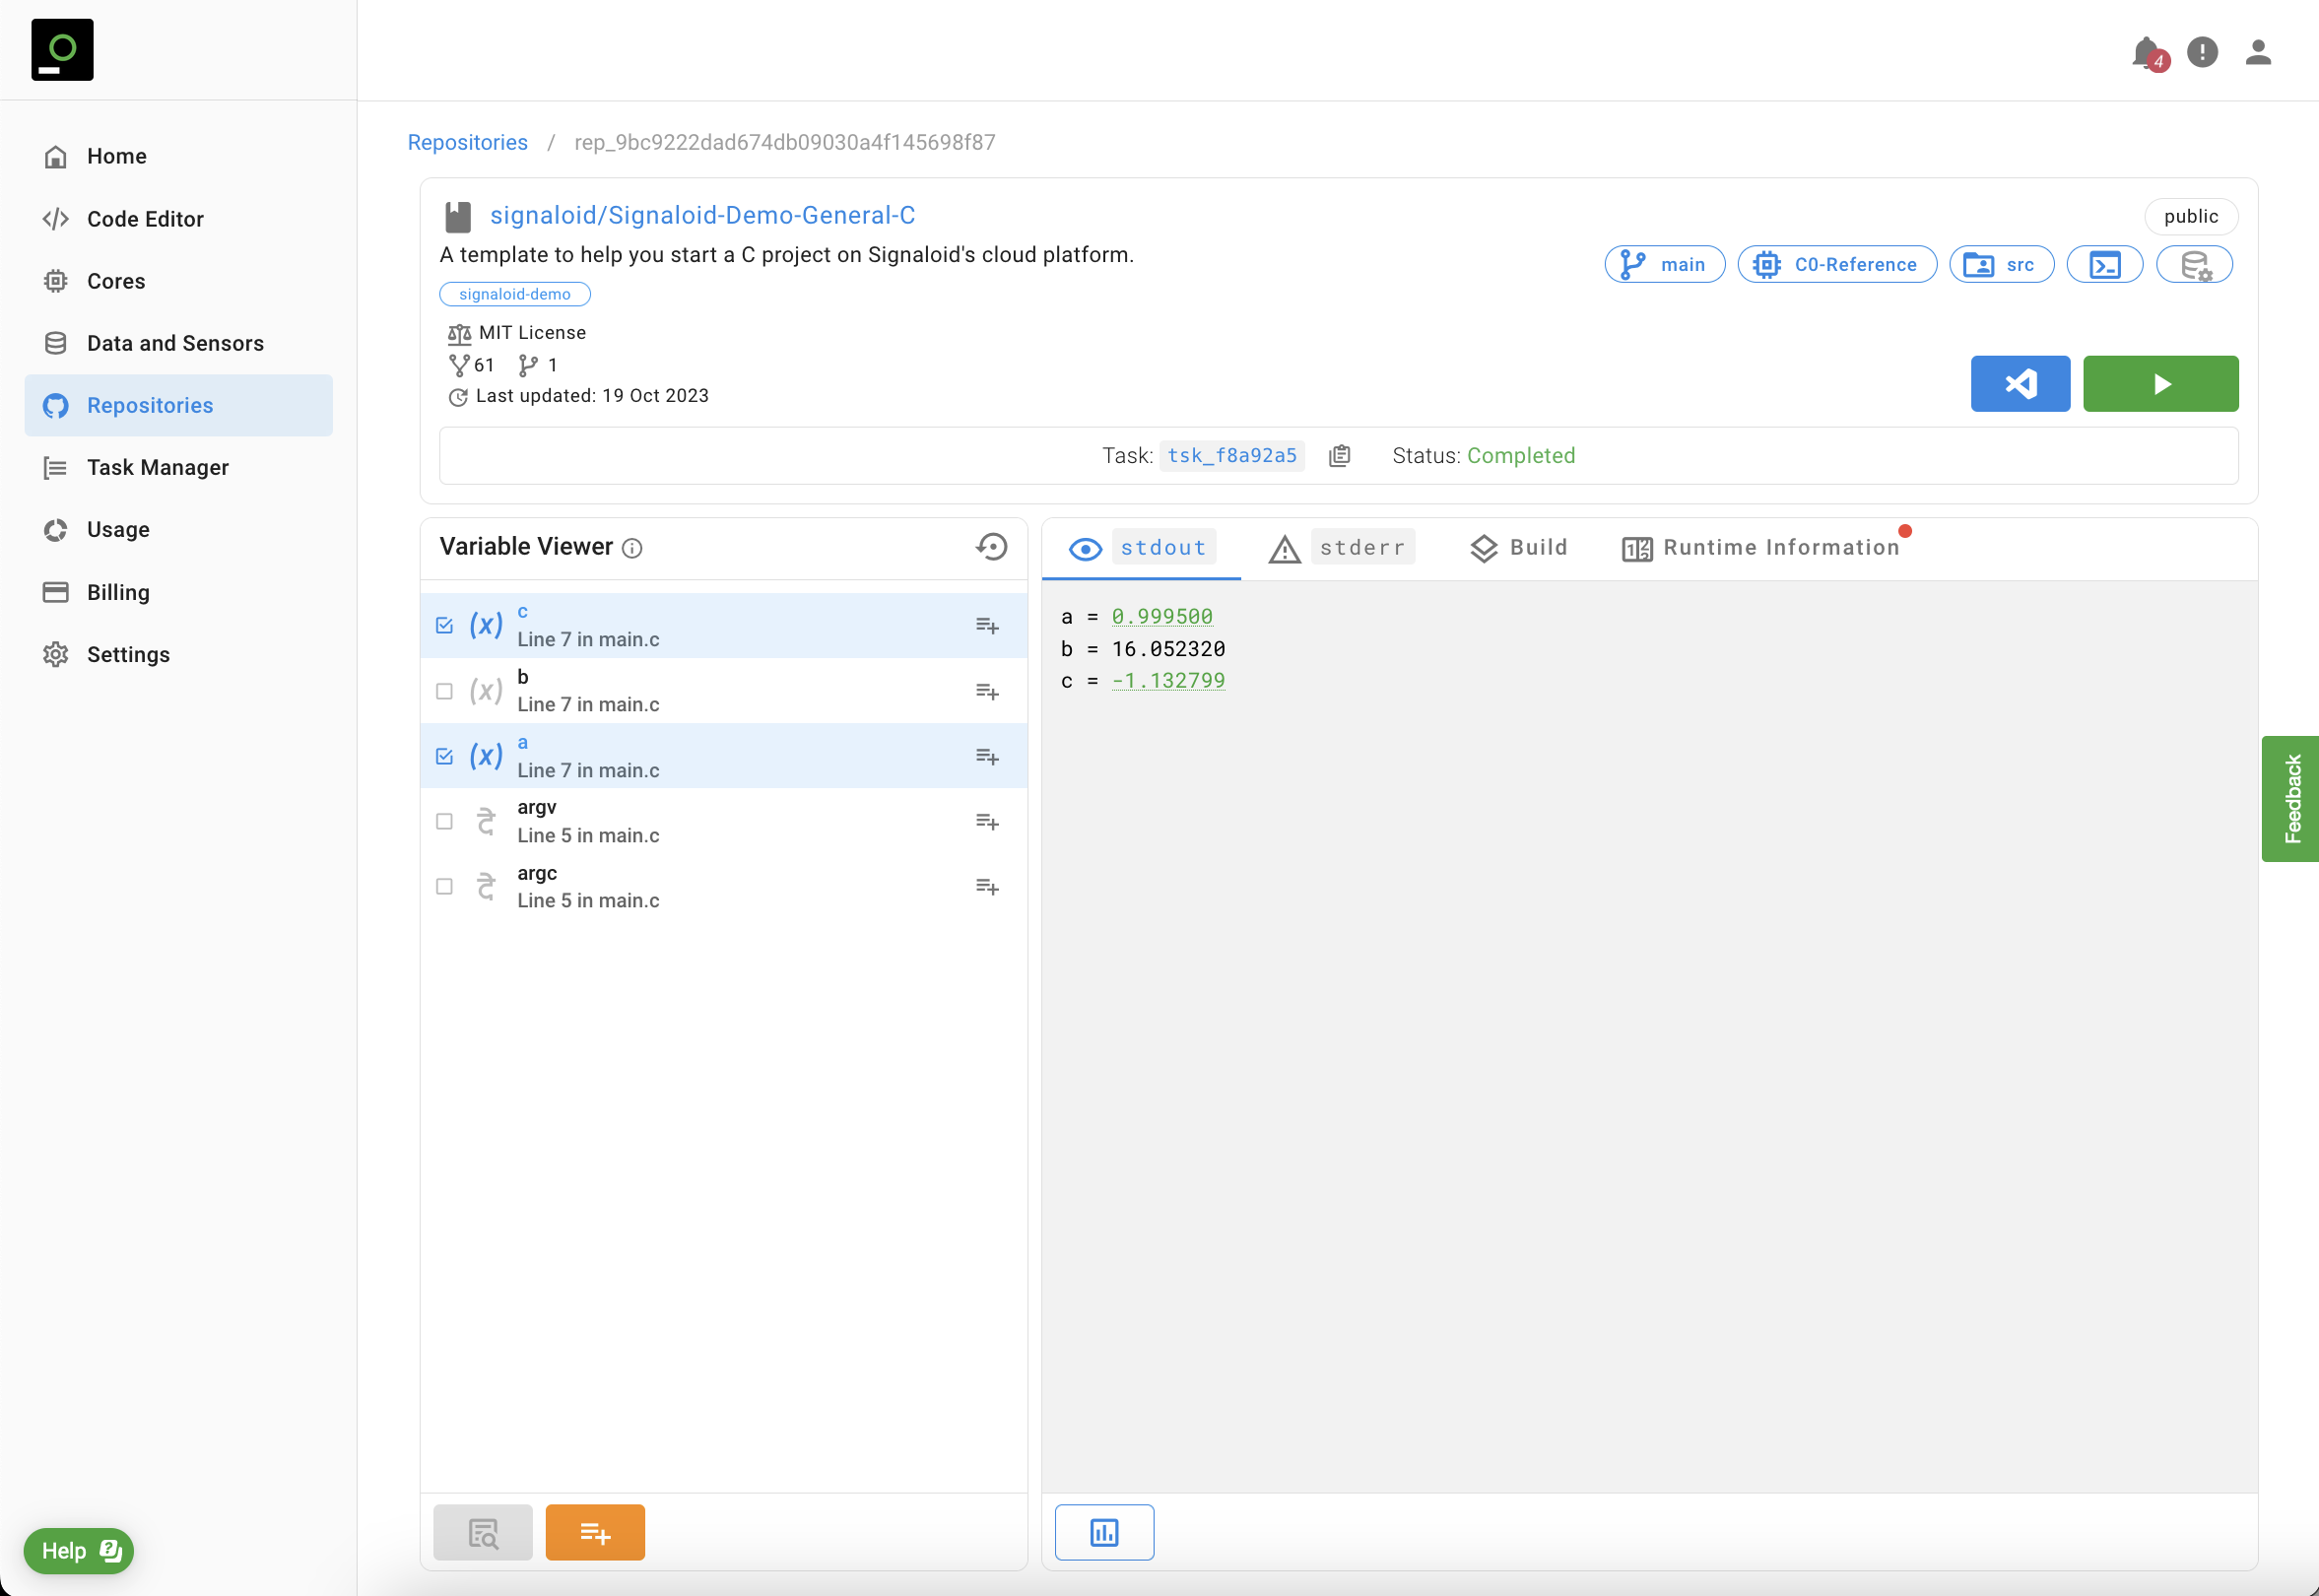
a and b appear twice in the list. This is because they are defined twice, as local variables in the main function and as parameters of the function loadDataFromFile. You need to select the variables that you want to trace from the list of the Variable Viewer.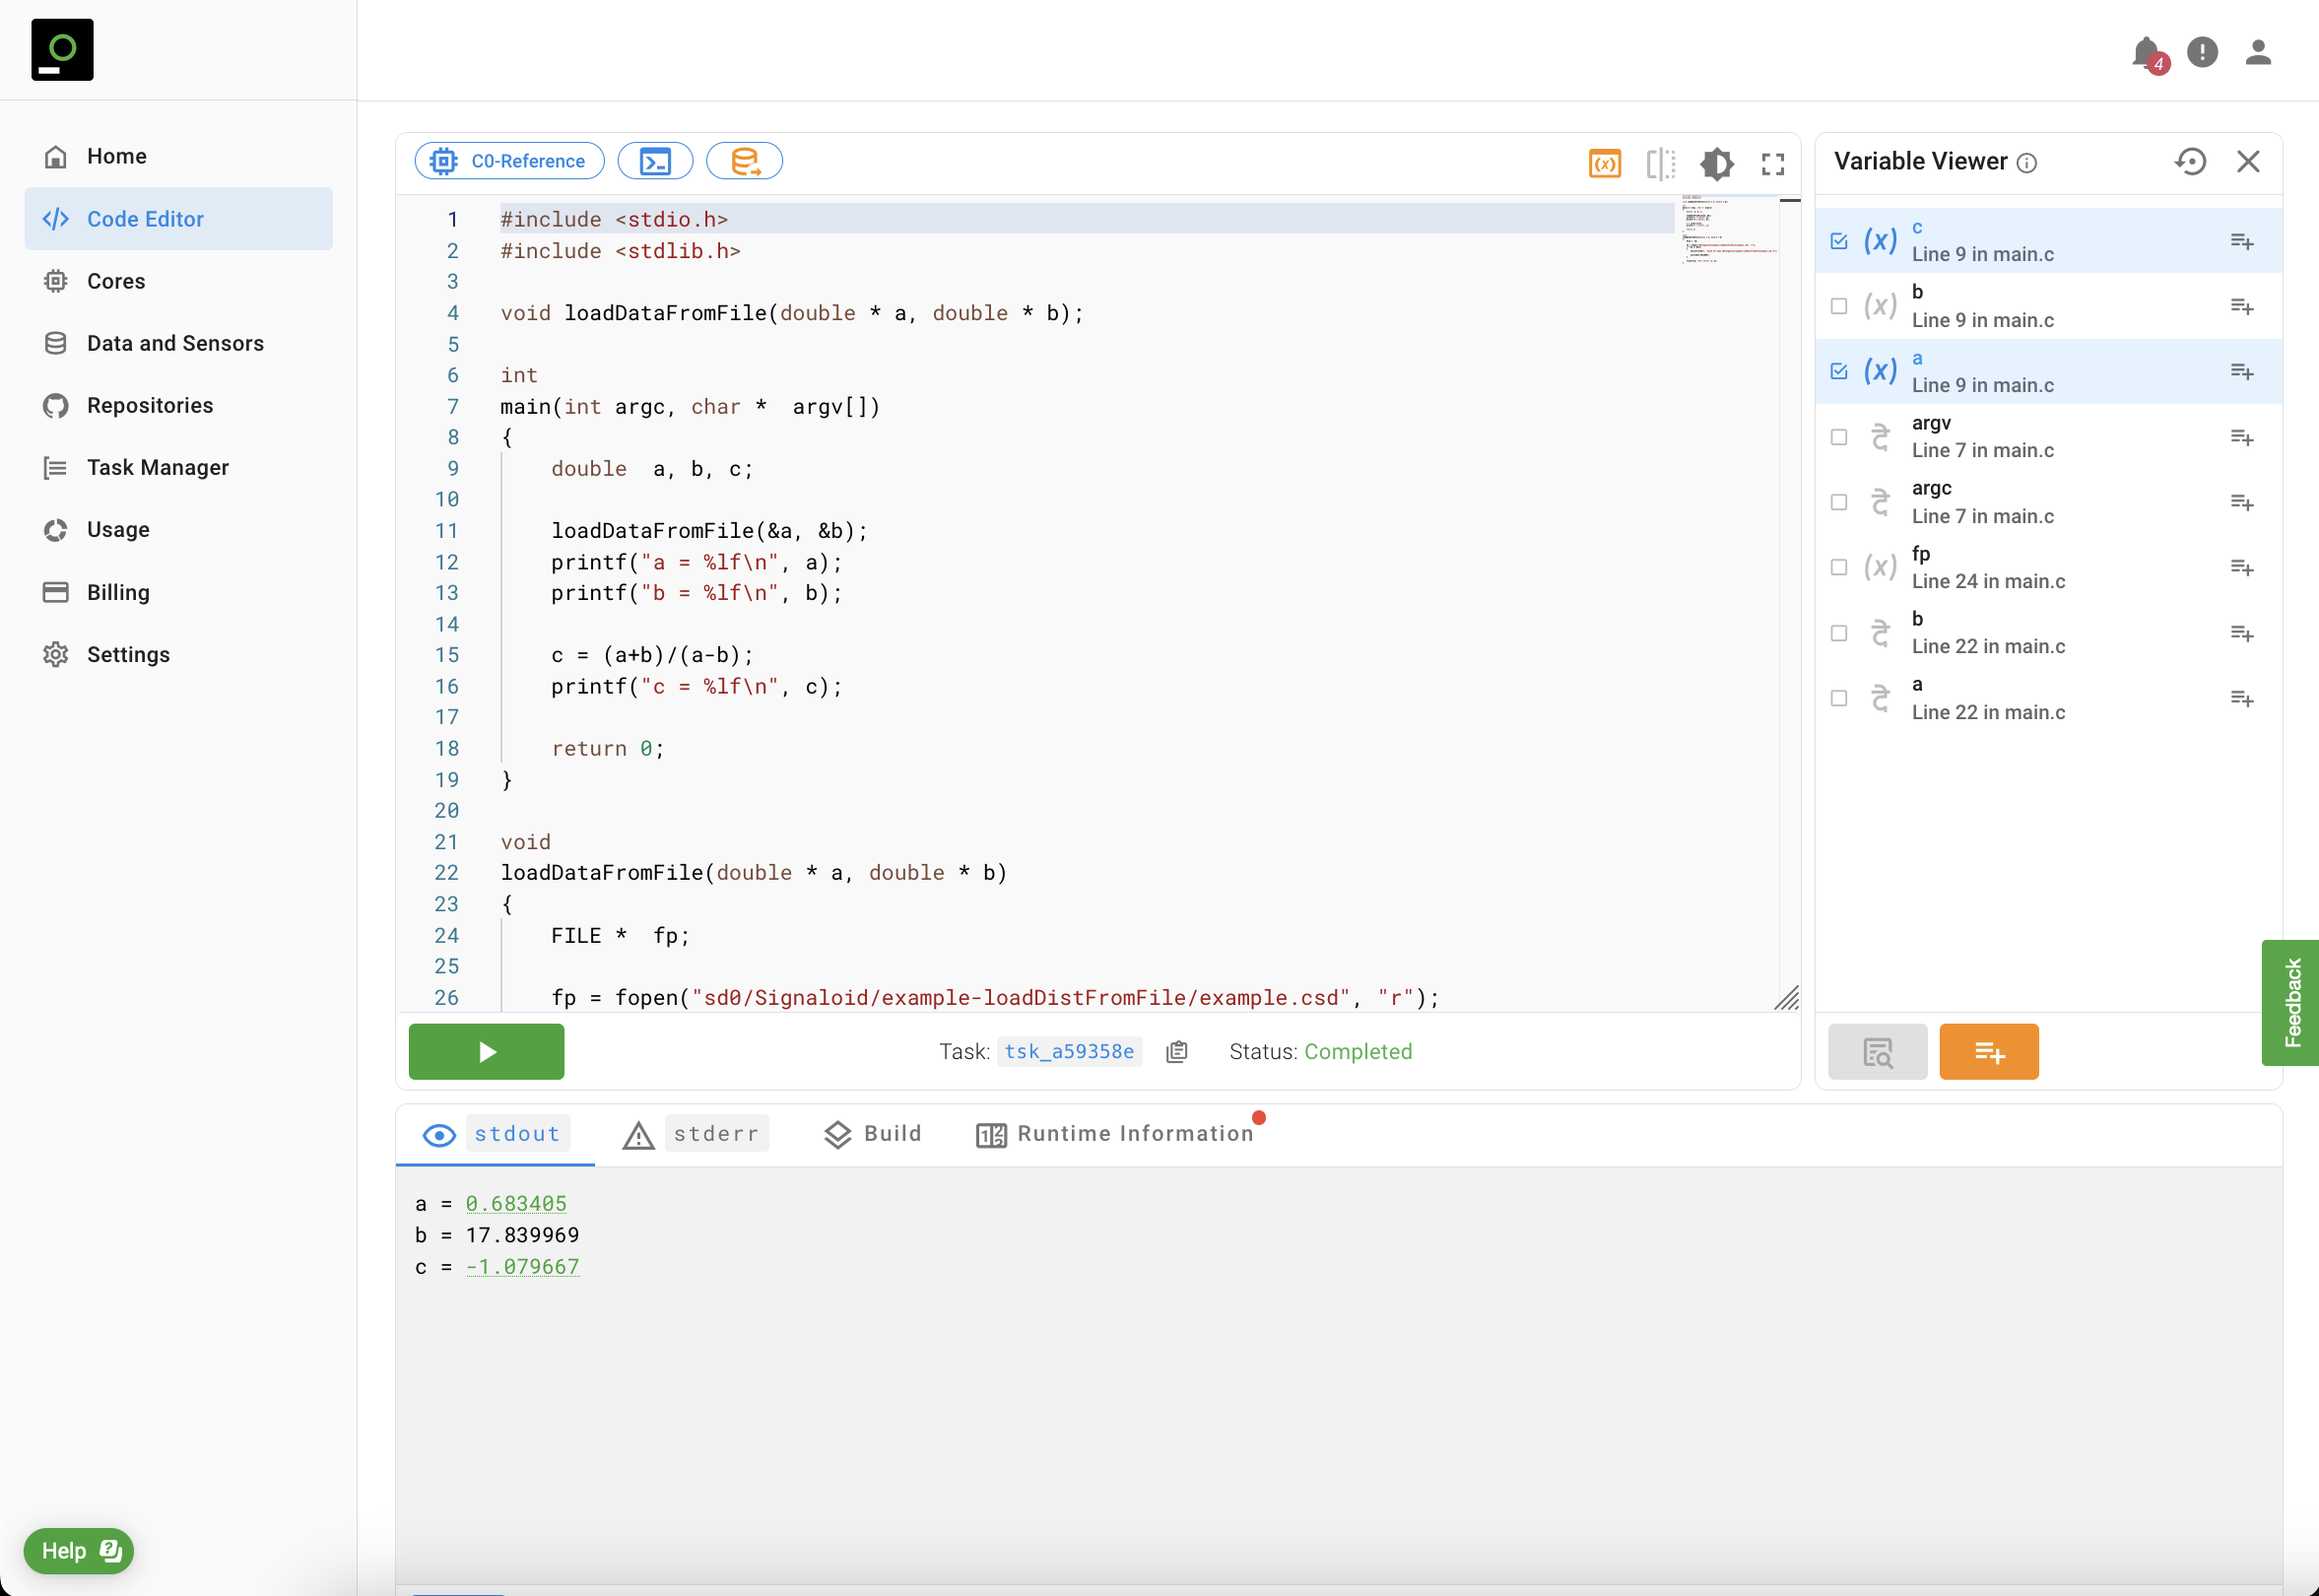
a and c defined in the main function. You can see in the stdout of the run that Signaloid Cloud Developer Platform has highlighted the printed outputs for variables a and c in green. You can hover over the green hyperlink to see the distributional plots of variables a and c. Because we have not instructed Signaloid Cloud Developer Platform to trace variable b of the main function, the printed output of variable b is not highlighted and you can see only its particle value.To construct the output distributions of a reference run, the Signaloid Cloud Developer Platform takes into account the expressions that your application prints. Your source code needs to print the variable
that you have instructed the Signaloid Cloud Developer Platform to trace, and not expressions that this variable appears in. For example, if your source code defines the variable double seconds, which you output using the call
printf("Milliseconds = %lf\n, seconds * 1000) then the Signaloid Cloud Developer Platform in a C0 reference core run will not create the distributional outcome for the printed expression seconds * 1000, even if you ask it to
trace the variable seconds. For successful tracing you can define and print double milliseconds = seconds * 1000 and ask the Signaloid Cloud Developer Platform to trace it.
Tracing Custom Variables
The Signaloid Cloud Developer Platform allows you to run applications on C0 Reference cores and trace elements of arrays of arbitrary dimensions as well as single and double-precision floating-point elements in user-defined structs.
For such cases, Signaloid Cloud Developer Platform offers the Add Custom Variable Trace button which allows you to explicitly specify the element that you wish to trace,
e.g., array[1] or foo.bar. Again, you need to specify the source code file and source code line of the declaration of the base variable, i.e., array for array[1] and foo for foo.bar. You can also
trace elements of dereferenced pointers that point to structs, e.g., foo->bar, provided that bar is an element of single or double floating-point precision.
For arrays, you can specify a range of elements that you want to trace using : to specify the start and end of the range. For example, using array[0:3],
will ask the Signaloid Cloud Developer Platform to trace array[0], array[1], array[2], and array[3]. You can also use this notation to trace elements of dynamically allocated arrays of single or double floating-point precision.
Using : to specify the range of elements that you wish to trace is valid for multidimensional arrays, e.g., you can ask the Signaloid Cloud Developer Platform to
trace array[0:4][0:2]. Figure 3 shows the addition of a custom variable trace for a single-dimensional array of the C programming language and Figure 4 shows the output of the respective C0-reference core run.
We currently do not support the ability to add a source code variable as the lower or upper bound of the array elements that you want to trace, e.g., array[0:N], where N is an integer variable of your source
code. However, tracing will work correctly if you specify an upper bound that exceeds the dimensions of a statically or dynamically allocated array. For example, let double * array be an array that you
dynamically allocate to have 64 elements. Instructing the Signaloid Cloud Developer Platform to trace array[0:128] is a valid option.
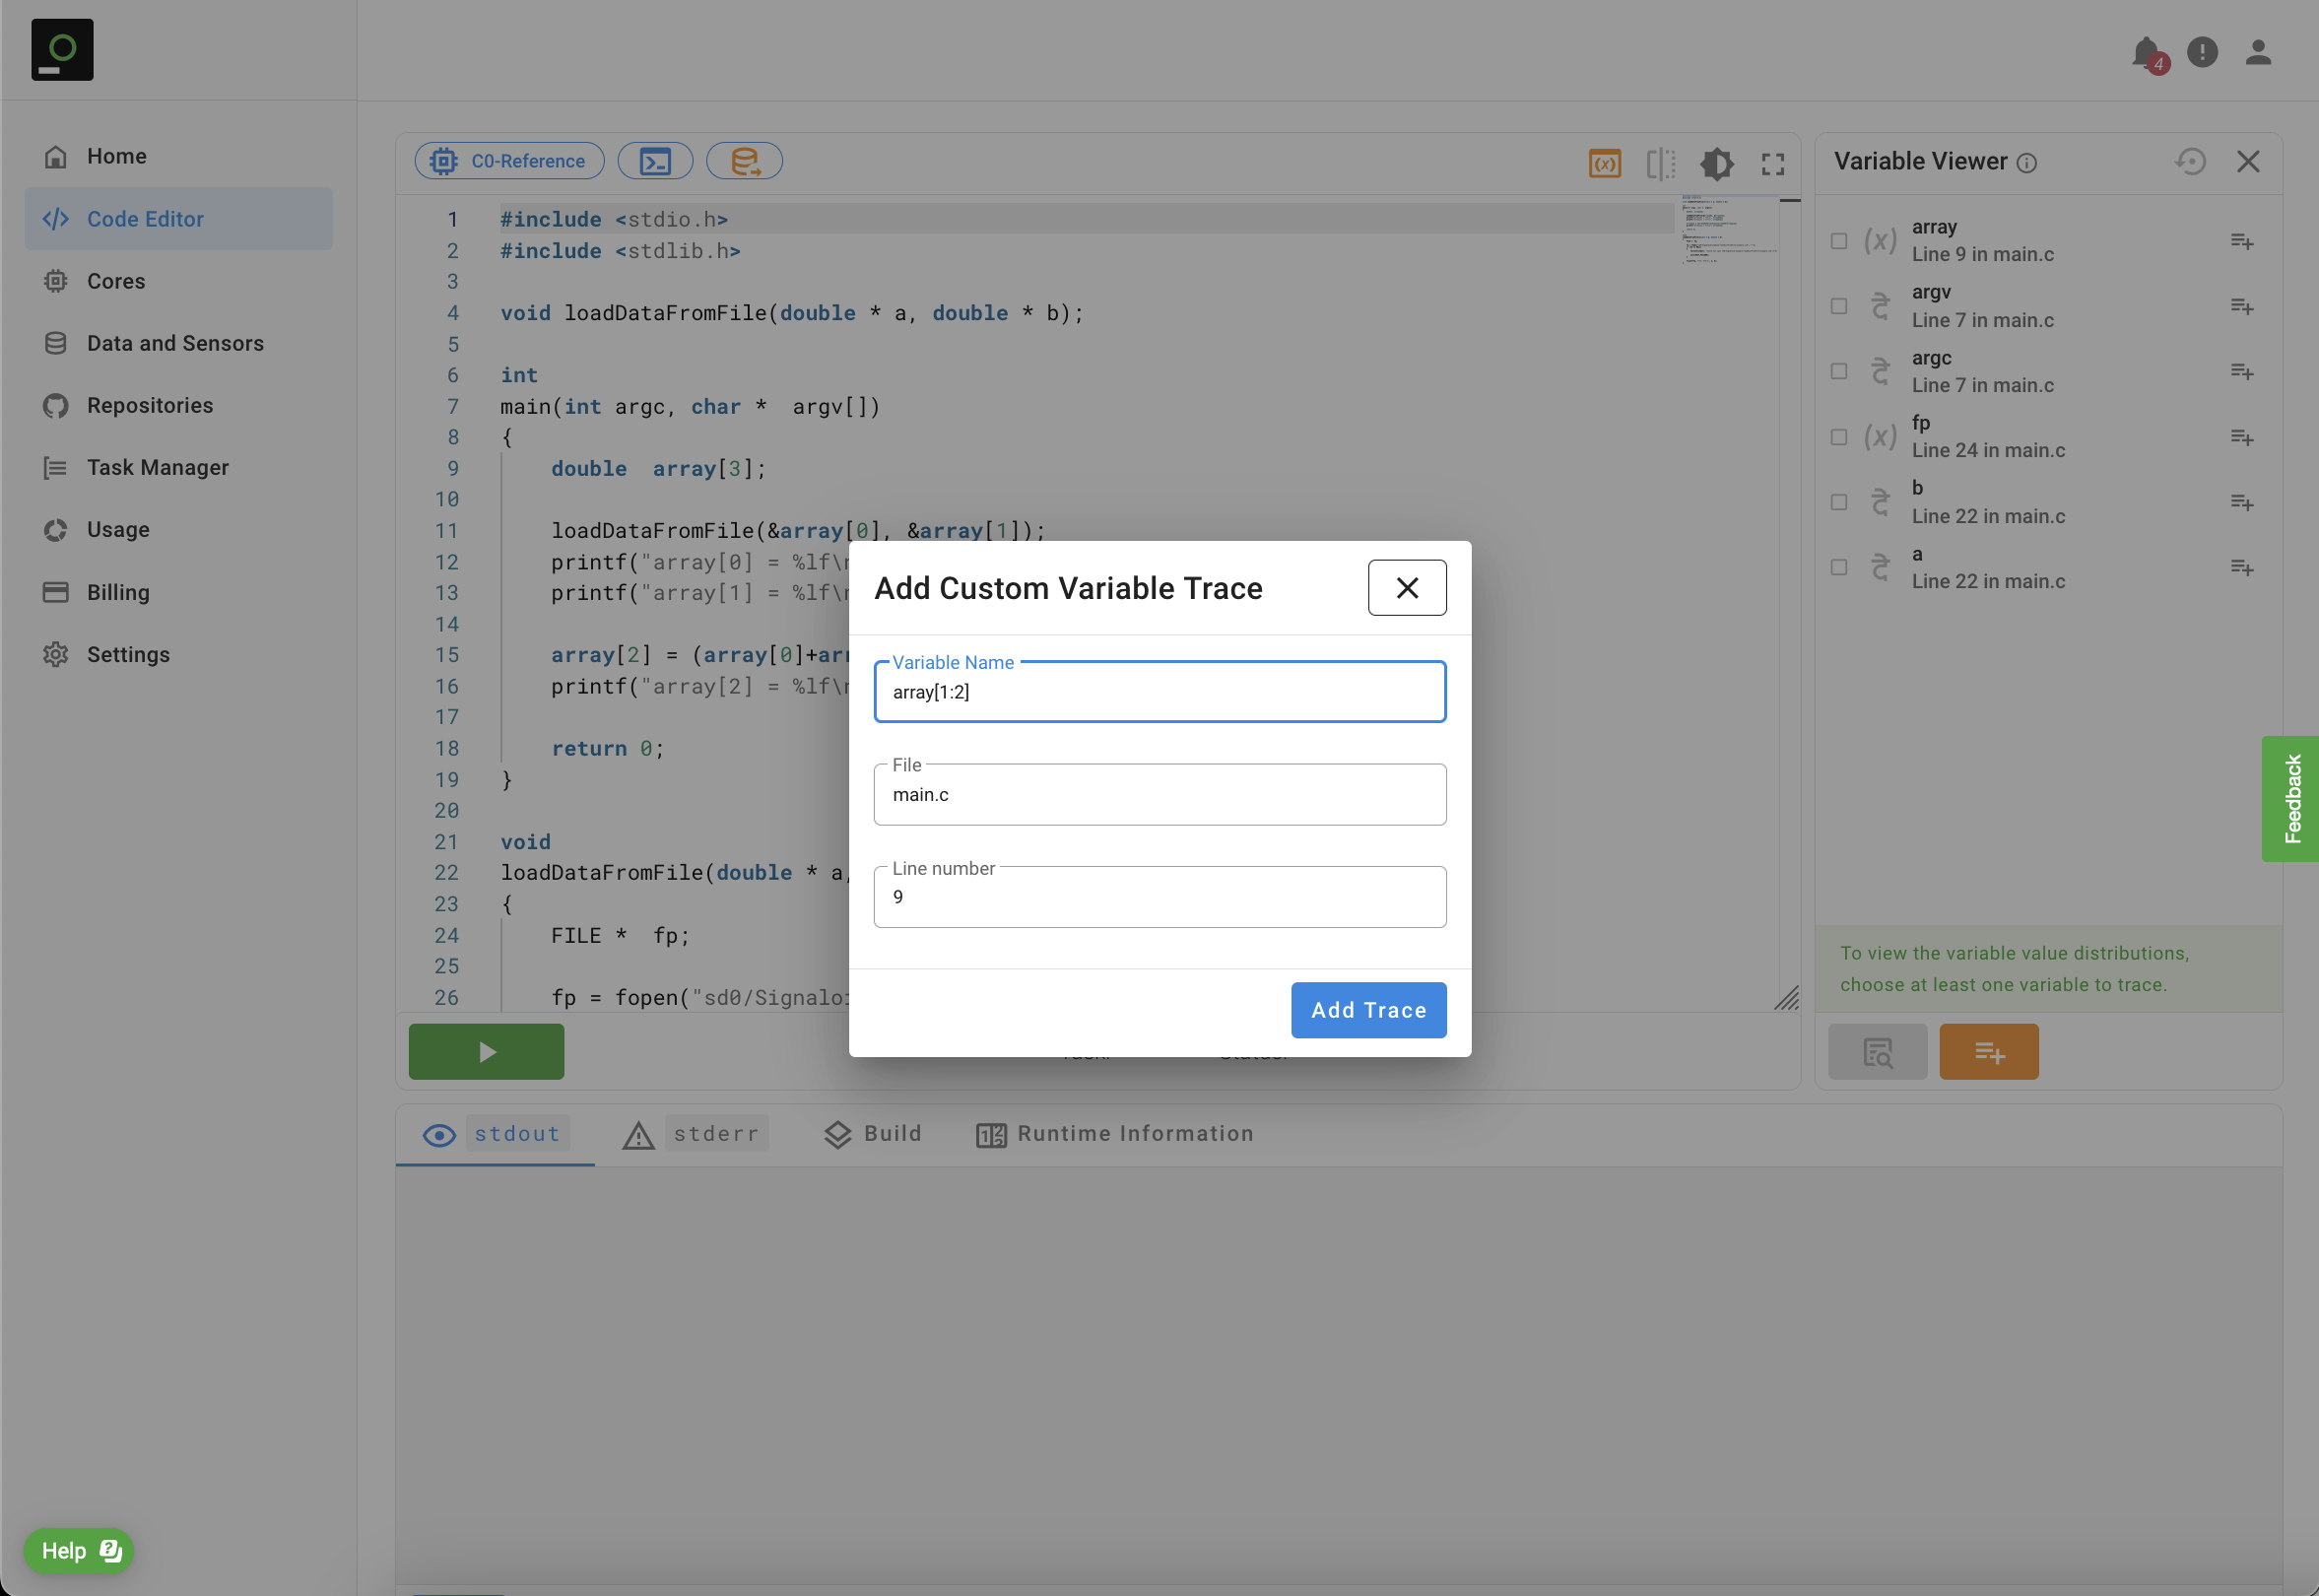
array variable of the source code. To ask the Signaloid Cloud Developer Platform to trace elements array[1] and array[2] you need to add array[1:2] as the "Variable Name". In the field "File" you need to enter the file where you define the array variable. For Code Editor runs by convention the file name is main.c. You also need to specify the line number of the declaration of array. For the specific example this line number is nine, and corresponds to double array[3].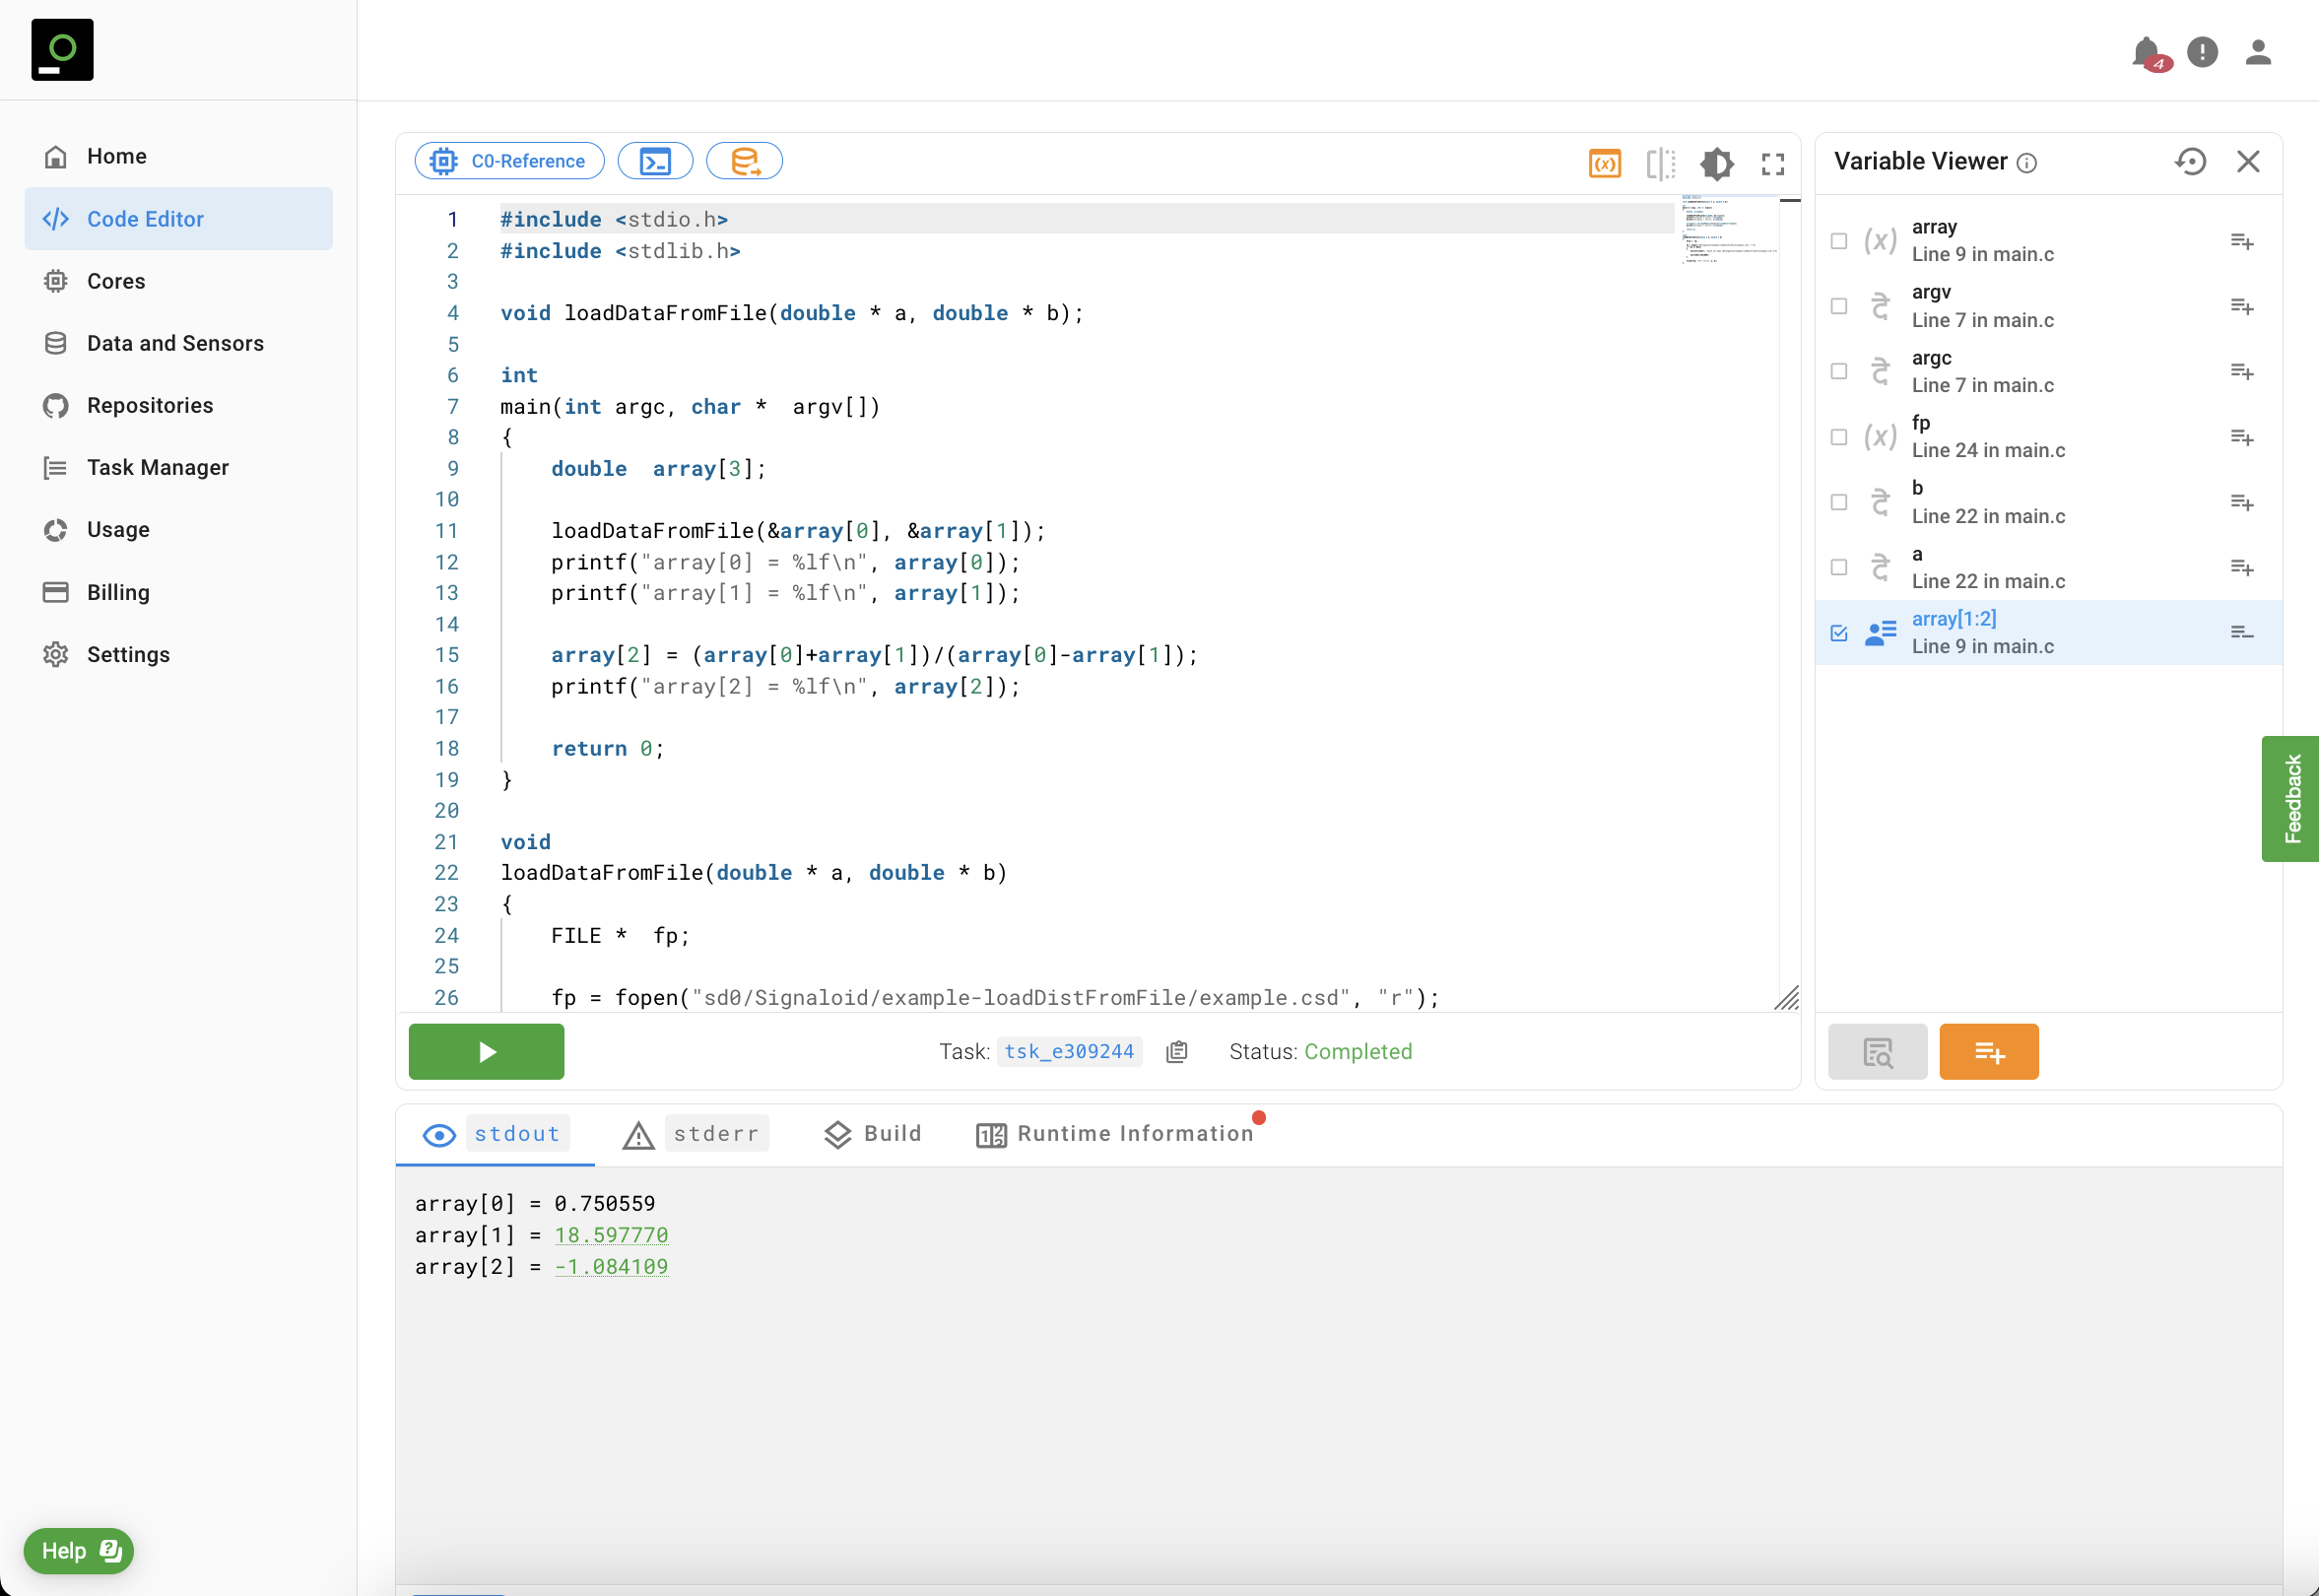
stdout of the run that Signaloid Cloud Developer Platform has highlighted the printed outputs for variables array[1] and array[2] in green. Because we have not instructed the Signaloid Cloud Developer Platform to trace variable array[0], the printed output of variable array[0] is not highlighted and you can see only its particle value.Reference Runs for Repositories
Before you run repository application on a C0 Reference core you need to select the variables you want to trace. In the Repositories page, in the individual card of each one of your connected repositories you can click the "Discover Variables" button to navigate to a page where you can see the "Variable Viewer" for the repository that you want to run. On this page, you can click on the "Discover Variables" button, to get the list of available variables in the source code of your connected repository. Exactly as in a Code Editor run, you need to select the variable that you wish to trace or add custom variables that you wish to trace.
a and c defined in the main function. You can see in the stdout of the run that the Signaloid Cloud Developer Platform has highlighted the printed outputs for variables a and c in green. You can hover over the green hyperlink to see the distributional plots of variables a and c. Because we have not instructed the Signaloid Cloud Developer Platform to trace variable b of the main function, its printed output is not highlighted and you can see only its particle value.Setting Traced Variables Using signaloid.yaml
For source code repositories runs, you can automate the process of adding traced variables, either regular or custom ones, by adding a signaloid.yaml file at the top-level directory of your repository.
Our YAML parser looks for a dictionary with the name TraceVariables, which contains a list of records that must contain Expression, which is the name of the (custom) variable that you wish to trace,
File, the path relative to your top-level repository directory that you define the variable that you wish to trace, and LineNumber, which is the line number of the declaration of the variable that
you wish to trace. The following code snippet shows an example signaloid.yaml file, which shows how you can instruct the Signaloid Cloud Developer Platform to trace simple or custom variables.
TraceVariables:
- Expression: "oneVariable"
  File: "src/main.c"
  LineNumber: 384
- Expression: "oneStructPointer->oneElement"
  File: "src/data-structures.c"
  LineNumber: 42
- Expression: "oneArray[0:15]"
  File: "src/lib/array-operations.c"
  LineNumber: 18
You can read more about the signaloid.yaml here.