Validate Performance
Measure the speedup of UxHw® over Monte Carlo for a published Signaloid benchmark, on your own account.
Overview
A benchmark is a published Signaloid demo application with a predetermined repository, branch, Signaloid core, and Monte Carlo sample count. A benchmark run executes the application once on a UxHw core, then compares its execution time against a Monte Carlo baseline of the same application source code.
The Validate Performance page () lists every benchmark Signaloid publishes and lets you run any of them on your account. For a first run from start to finish, see the Validate Signaloid Performance on Your Account tutorial. For individual tasks, see How to Validate Performance.
The page has two views:
| View | Path | Contents |
|---|---|---|
| Benchmark list | /validate-performance | One card per published benchmark |
| Benchmark run | /validate-performance/<benchmark ID> | A four-step run of one benchmark |
Benchmark list
The heading Validate Signaloid Performance shows the number of published benchmarks. The How we measure speedup? link opens a technology explainer on the method.
Category filters
A row of buttons above the list filters the benchmarks by industry, for example Digital Banking, Quantitative Finance, Industrial Automation, or Engineering Design. Each button shows the number of benchmarks in its industry. All benchmarks shows every industry.
The page first selects the industry you chose when you signed up, if a benchmark exists for it. All benchmarks shows eight cards at first. Click Show all {n} benchmarks to list the rest.
Benchmark card
Each card shows:
| Element | Description |
|---|---|
| Category and use case | The industry and the name of the application |
| View Source Code | Opens the benchmark repository on GitHub |
| Published speedup | The speedup Signaloid measured and published, for example "466× faster than Monte Carlo" |
| Core label | The core the benchmark runs on, for example C0Pro-L |
| Non-configurable | Signaloid sets the core and branch, and you cannot change them, so you can compare your results directly with Signaloid's |
| Try your own configuration | Opens the signaloid-python repository. Its benchmarking tool benchmarks the application with your own configuration |
| Run Benchmark | Starts a benchmark run. Reads Re-run Benchmark once a report exists |
The right side of the card shows the result of your last run. Before the first run it reads Never run. After a run it shows Measured, the speedup, and where the baseline ran.
Download report downloads the latest report from your Cloud Storage.
The card reads the measured speedup from your browser's storage. On another browser or device, the card shows only that a report exists in your Cloud Storage.
Unavailable benchmarks
The card disables Run Benchmark when your account cannot use the benchmark's core. The card states the reason:
| Reason | Card message |
|---|---|
| Your plan does not include the core | "Your plan does not include {core}, the core this benchmark is measured on." |
| Your account cannot access the core | "This benchmark is measured on {core}, which your account cannot access." |
| The core is deprecated | "{core} is deprecated, so it can no longer run builds." |
| The core is unavailable | "This benchmark is measured on {core}, which is not available right now." |
A Compare plans link opens the plan comparison.
Benchmark run
Clicking Run Benchmark opens the run view and starts the run. The header
shows the use case and the repository as owner/repo · branch. The Validate
Performance back button returns to the list.
Before the first build, the platform connects the benchmark repository to your
account, so it appears under
Connected Repositories.
The repository stays connected after the run. If you already connected the
repository with a different branch or build directory, the run builds from
src/ on main, then restores your branch and build directory after it submits
the build.
A stepper at the top tracks four steps.
Step 1: UxHw run
The platform builds the application on the benchmark's core and runs it once. That single execution returns the full output distribution.
The step shows a Build and a Task row, each with its ID ( to
copy) and its status, which moves through Accepted, Initialising,
In Progress, and Completed. A run that does not complete shows Cancelled
or Error in place of the last status.
The first result card, Run 1 of 2, shows:
- C0 execution time, the processor time the task reports under Runtime Information.
- Dynamic instruction credits the task used.
- Task duration, including platform overhead.
- The program output with its distribution plots.
Cancel run stops the run. Next: Monte Carlo baseline moves to the next step once the run completes.
Step 2: Choose environment
Choose where the Monte Carlo baseline runs:
| Option | Credits | Requires |
|---|---|---|
| Local (Recommended) | None | git, make, a C toolchain, and GSL |
| Cloud | Not applicable | Not yet available |
Continue to local run moves to the next step.
Step 3: Monte Carlo run
For a Local run, the step lists four sub-steps:
- Clone the repository, with the
git clonecommand and a copy button. - Run the baseline, with the command that builds the native Monte Carlo version of the application and runs it with the benchmark's sample count, and a copy button.
- Import std.out, the output the application printed.
- Import data.out, the execution time and samples of the run. Available
after you import
std.out.
For either import, drop the file on the page or choose it with the file picker.
Your browser reads data.out, and a progress indicator shows how much it has
read. See comparison moves to the next step after you import data.out.
Step 4: Comparison
The comparison shows:
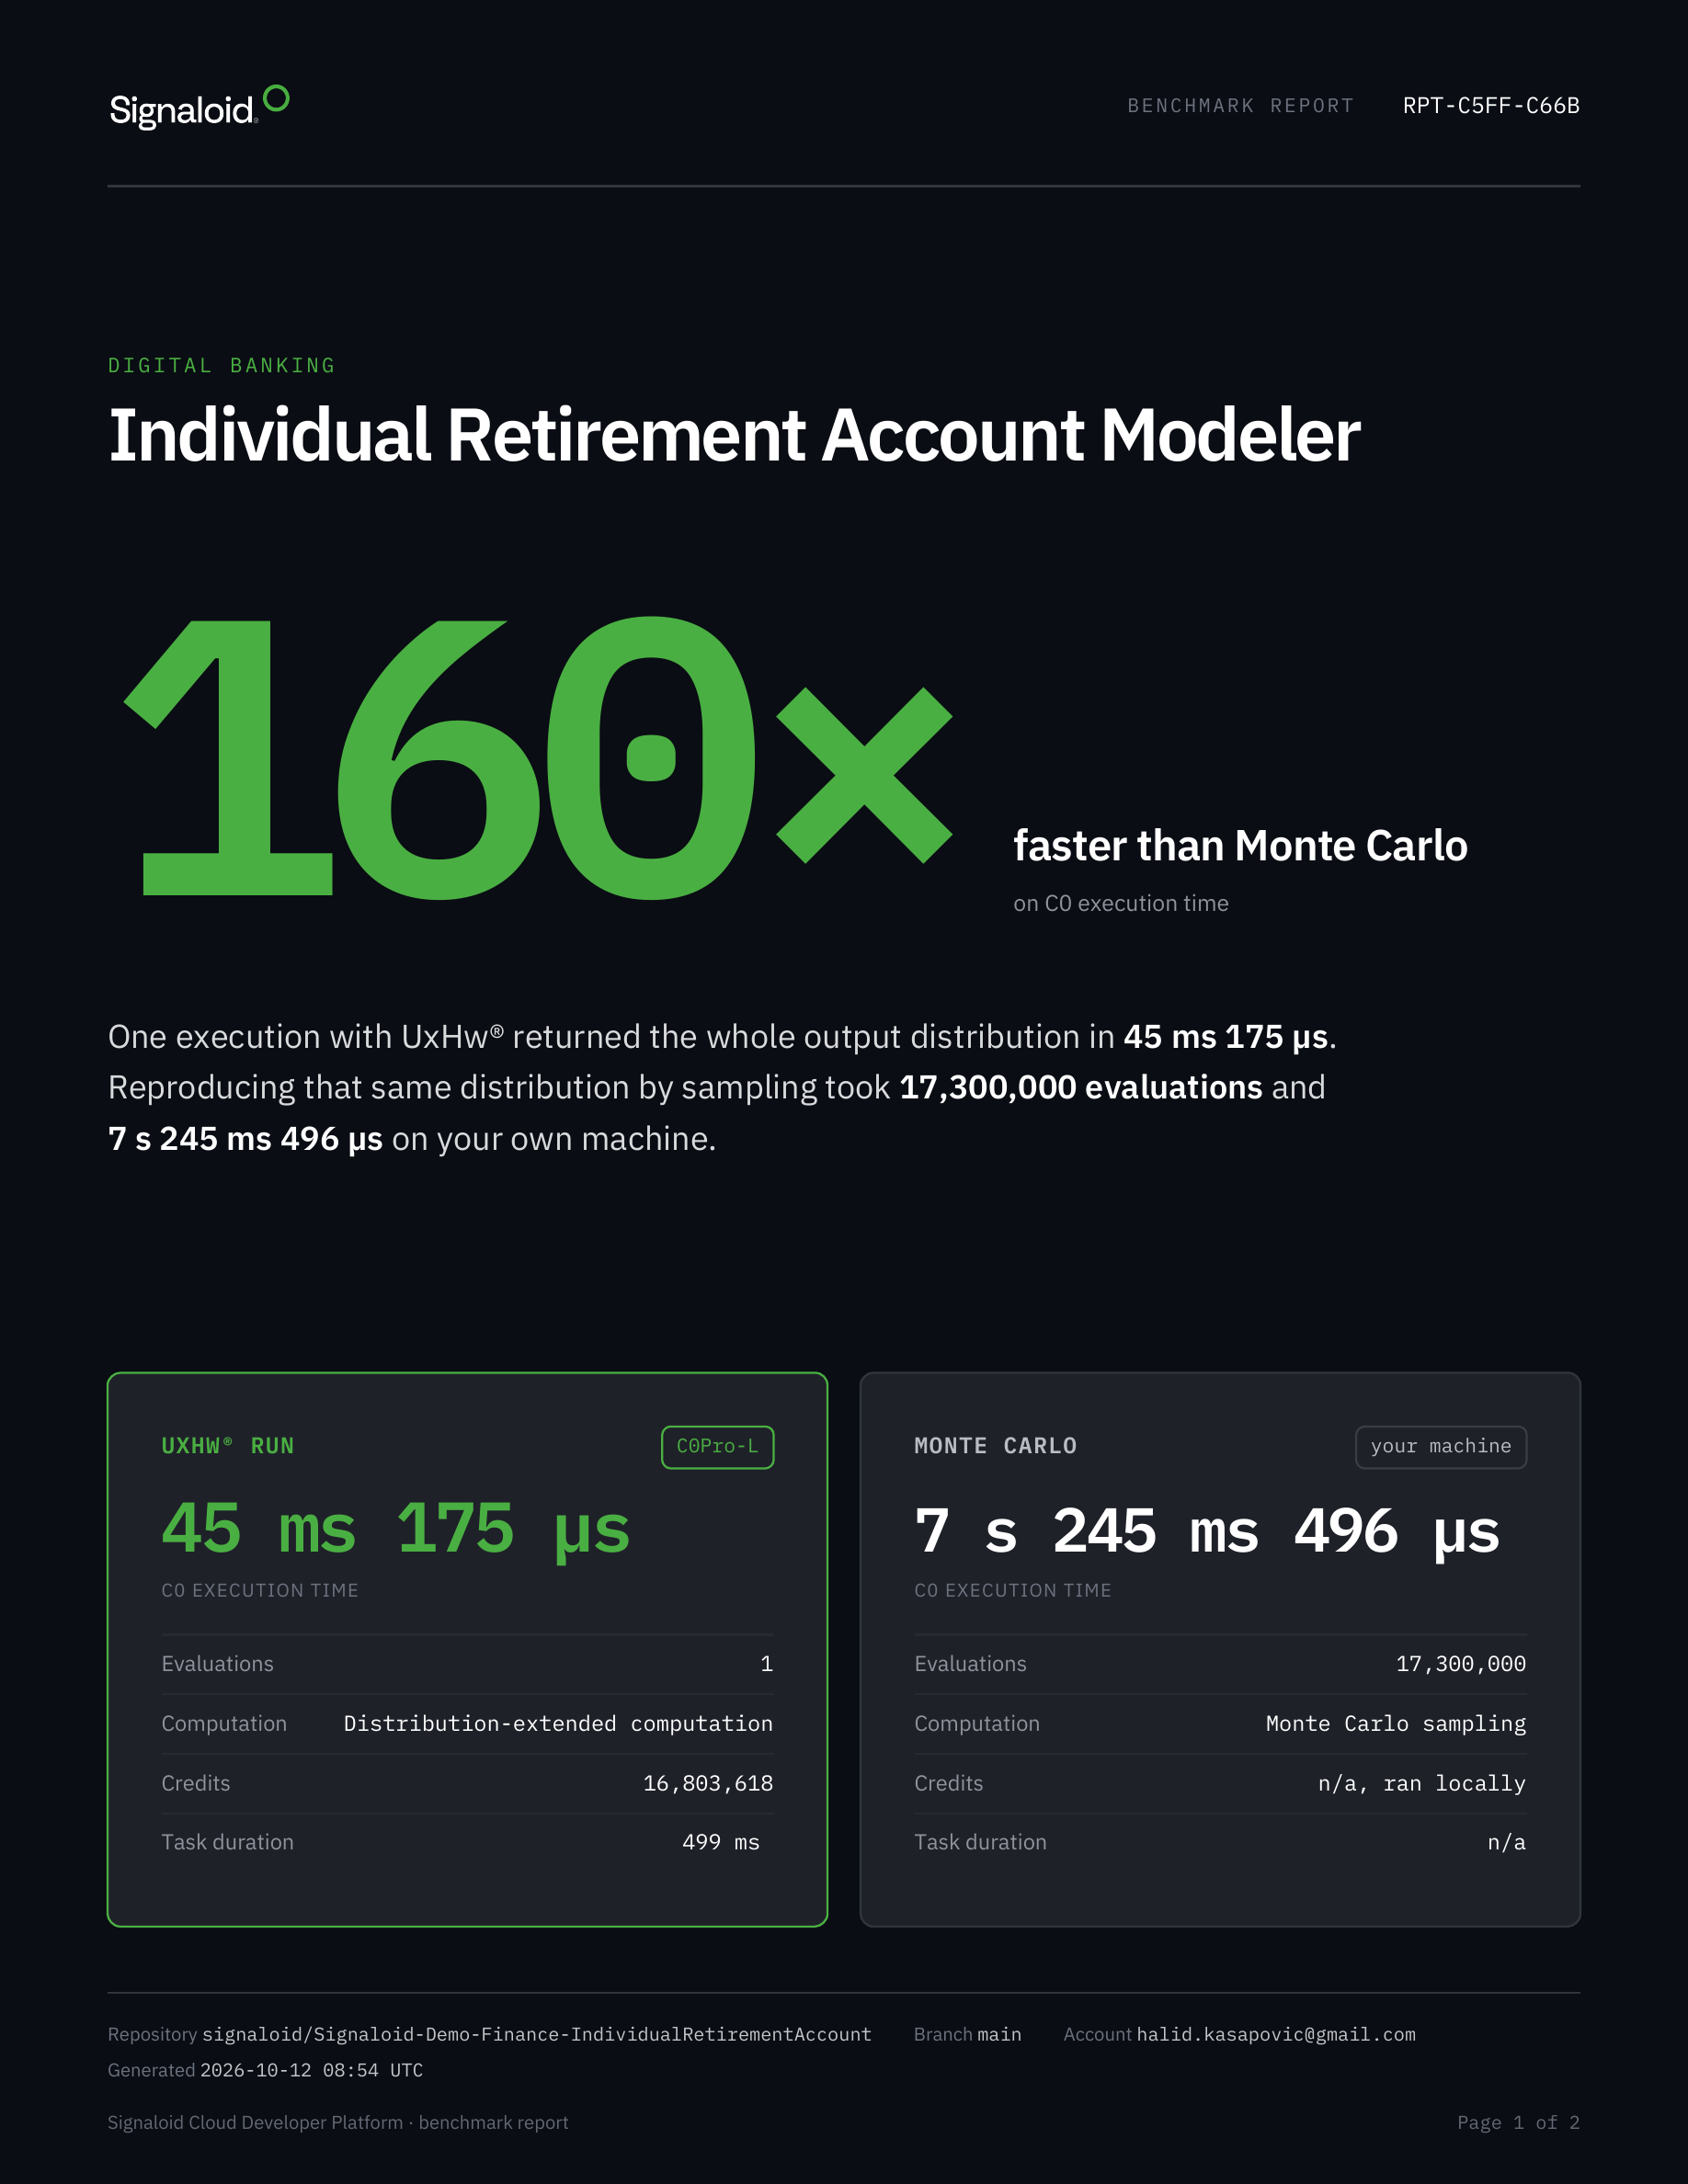
- Speedup, the measured "× faster than Monte Carlo" figure: the Monte Carlo execution time divided by the UxHw C0 execution time.
- Bar chart, two bars on a linear scale: UxHw on the benchmark's core and Monte Carlo on your machine.
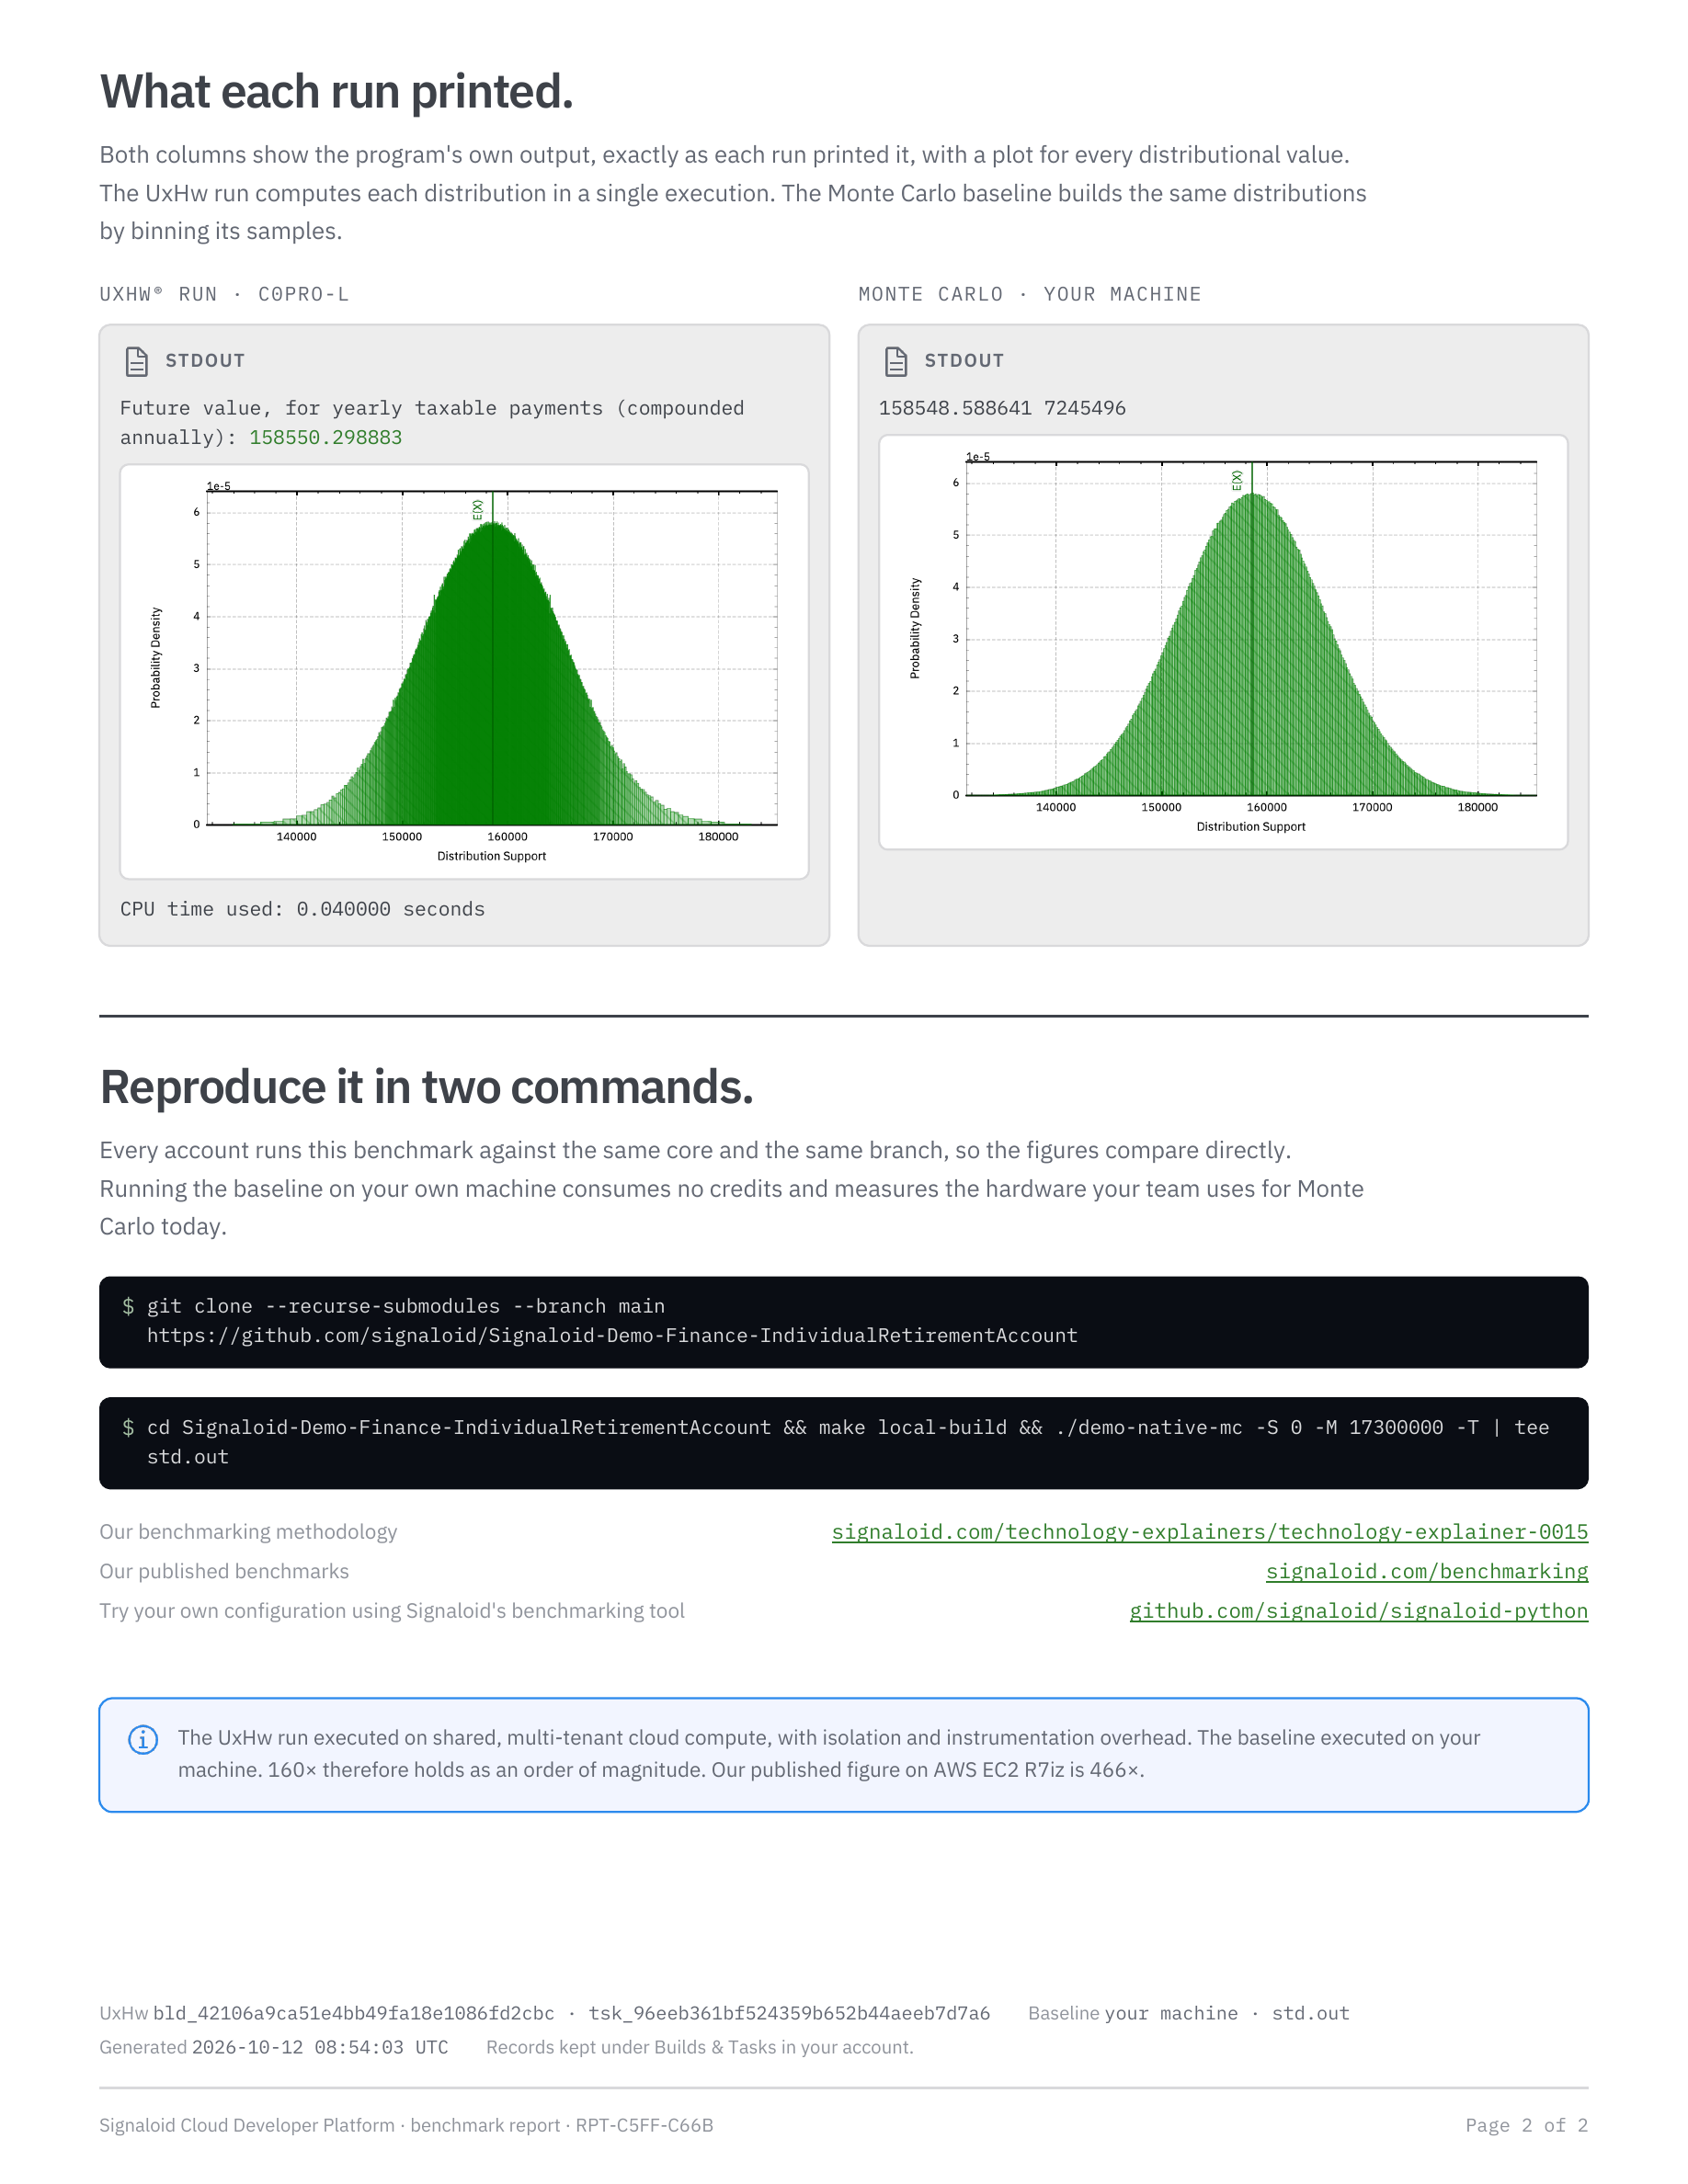
- Result cards, one for each run. The Monte Carlo card for a local run shows a histogram of the imported samples, on the same axes as the UxHw distribution plot.
- Tiles for UxHw C0 execution time, Monte Carlo execution time, the number of baseline samples, and Signaloid's published figure.
- Interpretation note, which states that the two runs used different environments, so the speedup is an order-of-magnitude figure.
Run benchmark again starts a new run. Download report downloads the report as a PDF. Back returns to the previous step.
If you close the page, you lose the comparison. Leaving the page does not stop a running task, and the task appears on the Builds and Tasks page, but you must start a new benchmark run to get a comparison.
Speedup
The speedup is the Monte Carlo execution time divided by the UxHw C0 execution time:
| Value | Source |
|---|---|
| UxHw C0 execution time | ProcessorTime of the UxHw task |
| Monte Carlo execution time, local | The first line of data.out |
The page shows both execution times in mixed units, for example "159 ms 628 μs".
The page rounds speedups of 10× or more to whole numbers, for example "466×", and speedups below 10× to one decimal place, for example "5.2×". Below 1×, the label reads "the Monte Carlo speed" in place of "faster than Monte Carlo", for example "0.5× the Monte Carlo speed".
Local result files
The local baseline command writes two files to the root of the cloned repository:
| File | Contents | Checks on import |
|---|---|---|
std.out | The output the application printed | Must be under 5 MB and not empty |
data.out | The execution time in microseconds on the first line, then one sample per line | Must hold exactly the benchmark's sample count |
The import skips lines in data.out that start with #. If std.out contains
a CPU time used: X seconds line, the timing in data.out must agree with it
within 5%.
Benchmark report
When you reach the comparison, the platform saves a two-page PDF report to your Cloud Storage at:
Performance-Validation/Reports/<benchmark ID>-benchmark-report-<YYYY-MM-DD>.pdf
The date uses UTC. A second run of the same benchmark on the same UTC day replaces that day's report.
| Page | Contents |
|---|---|
| 1 | Report ID, category and use case, the measured speedup, a data card for each run, the repository and branch, your account email, and the generation time in UTC |
| 2 | The output of each run, the two commands to reproduce the baseline, Signaloid's published figure, and the Build and Task IDs |
Limits
When you start a run, the platform checks your plan's limits on concurrent builds, concurrent tasks, and dynamic instructions. The UxHw run consumes dynamic instruction credits like any other task. The local baseline consumes none.
For your plan's limits, see Usage.